はじめに
2021年の8月に30 Days of MLがKaggleで開かれました。
私もでしたが、この機会にKaggleを始めた方も多いのではないでしょうか?
30日間の最初の1週目はPythonのコースを終わらせよう、ということでした。
この時にDiscord(現在は招待リンクがうごいていません)でいろいろと回答とかしていましたので、Discordサーバが生きているうちにまとめておきます。
Python
Learn the most important language for data science.
ということで
- Hello,Python
- Functions and Getting Help
- Booleans and Conditionals
- Lists
- Loops and List Comprehensions
- Strings and Dictionaries
- Working with External Libraries
の7項目がTutorialとExerciseの2つ準備されています。
Tutorialでその項の概要を学習したのち、Exerciseで実際に自分でコードを書いて確認していく流れになります。
日本語のページを作ってくれた方がいまして、Pythonが初めての方はこちらがいいでしょう。
Kaggle’s 30 Days of ML Daily Assignments
KeitoTanemuraさん、ありがとうございます。
ぱっと見Jupyter Notebookなkaggle Notebookで作られているので
google colaboratoryから来た人はKeyboard Shortcuts for Kaggle Kernelsを参照してください。
Exercise実施上の注意点
Exerciseをやっていくと「100%にならないよ〜」という声が多数Discord上に溢れていました。
その時のテンプレートの回答は「qX.check()をすべて終わらせてください」でした。
あとは「「qX.check()が動かないよ」というやつ。
これは「Click Run all」。 ほんと多かったですね ![]()
では次から各章の概説を紹介します。
Hello,Python
Pythonの四則演算や文字列操作について紹介されています。
Exercise: Syntax, Variables, and Numbers
このExerciseはどちらかというと、このExercise自体に慣れてもらうことを目指しているみたいで、必須モジュールのインストールやヒントの見方をまずは練習しています。
でも、問題があれば解きたくなるもの、特にヒントなんかいらないぜ!
ということでQ0の「What is your favorite color? 」で「わからないよ〜」という声がDiscord上に結構でていました。
ここは素直にq0.hint()やq0.solution()を実行してください。
なお、⌘ + /でその行をコメントに切り替えられるので使うと便利です。
Functions and Getting Help
ヘルプの見方と関数について。
Exercise: Functions and Getting Help
Q4は、バグがあるのを直すということで、エラーをしっかり見ることが必要でした。
TypeError:abs() takes exactly one argument (2 given)
SyntaxError: 'return' outside function
なので、absは引数を一つに、returnはインデントをしっかり作る必要があります。
エラーが何を意味しているのかをよく見れるようになると、それだけで初心者から一歩上に行ける気がしています。
Booleans and Conditionals
真偽値(TrueとFalse)と条件判定について
初めてPythonする人だと問題ないんだろうけど、他の言語やっているとごっちゃになりそう。
Exercise: Booleans and Conditionals
Q1は引数がマイナスだと-1プラスだと10だと0にする関数をつくれということ
kaggleの解法は素直にif``elif``elseで条件わけしていたので、別解法
def sign(num):
    return [-1,1][num > 0] if num !=0 else 0
3項演算子とTrue == 1でFalse == 0を利用してみました。
これってnumpy.signの動きそのものですね。
Q5cは^がXORなので、こちらを使ってもいいです。
Q7のshould_hitはディスカッションが別に立つくらいの問題なので、深入りしない方がいいです。
ディスカッションはこちら
Lists
ListとTupleの操作について。
結構レアなメソッドとか使っているので本家のサイトを適宜みたほうがいいと思います。
5. データ構造とか整数型における追加のメソッド
Exercise: Lists
Q3は
r = ["Mario", "Bowser", "Luigi"]
r[0],r[-1] = r[-1], r[0]
r
を利用するとスッキリかけます。
Q5は公式回答の動作がよくわからないという人が結構いましたのでpythontutor.comで一つ一つ追っていくといいと思います。
自分の回答だと
def fashionably_late(arrivals: list, name: str)-> bool:
    """Given an ordered list of arrivals to the party and a name, return whether the guest with that
    name was fashionably late.
    """
    fl = arrivals[-(-len(arrivals)//2):-1]

    return name in fl
と【Python】切り捨て除算演算子を使った切り上げ【算数】を利用して、math.ceilを使用しない感じでやってみました。
Loops and List Comprehensions
ループと内包表記
リスト内包表記の活用と悪用がとても参考になると思います。
Exercise: Loops and List Comprehensions
Q1のhas_lucky_numberは[num % 7 == 0 for num in nums]が[True, False, False, True]みたく展開されるので
組み込み関数 anyの解説どおりとなる。
Q4については
def estimate_average_slot_payout(n_runs):
    """Run the slot machine n_runs times and return the average net profit per run.
    Example calls (note that return value is nondeterministic!):
    >>> estimate_average_slot_payout(1)
    -1
    >>> estimate_average_slot_payout(1)
    0.5
    """
    r = [play_slot_machine() - 1 for _ in range(n_runs)]
    return (sum(r)) / n_runs

import matplotlib.pyplot as plt
from matplotlib.ticker import ScalarFormatter
import numpy as np
import pandas as pd

scale = np.linspace(100,1e6,100)
values = [estimate_average_slot_payout(int(i)) for i in scale]

fig, ax=plt.subplots(figsize=(10,5))
ax.plot(df)
ax.axhline(y=0.025, xmin=0.1, linestyle='--', color='r')
ax.annotate('0.025',xy=(0.95e6,-0.05),fontsize=16)
ax.set_ylim(-0.15, 0.15)

# 対数軸を数字表記にする。
formatter = ScalarFormatter()
formatter.set_scientific(False)
ax.xaxis.set_major_formatter(formatter)
# plt.show()
# plt.savefig('graph.png')
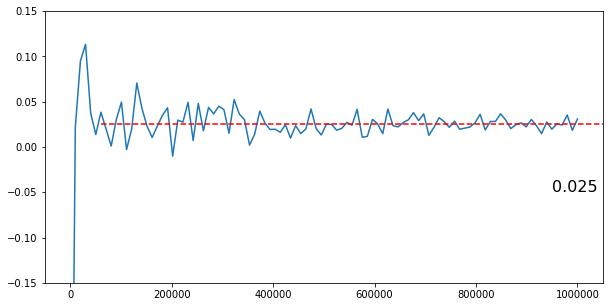
と100から1_000_000までの期待値をグラフ化してみると分かり易いと思います。
なお、kaggleのgithubをカンニングすると
# Analytic solution for expected payout =
# .005 * 100 + (.05 - .005) * 5 + (.25 - .05) * 1.5
となっていて、1.0250000000000001が期待値となっています。
Strings and Dictionaries
文字列と辞書の操作方法
しれっとstr.formatが出てきたりしているので、リンク先をいったんみた方がいいと思います。
Exercise: Strings and Dictionaries
Q2は貰い物ですが
def word_search(doc_list, keyword):
    import re
    return [ idx for idx, doc in enumerate(doc_list)
        if re.search(rf'{keyword}\b', doc, re.IGNORECASE)]
といった解法もあります。re.seachを使うと二重ループしなくていいので、かっこいいと思いました。
Q3は素直にこれを使えば楽ですよね。
自分は以下みたく、一からやってました。まだまだです。
def multi_word_search(doc_list, keywords):
    """
    Takes list of documents (each document is a string) and a list of keywords.
    Returns a dictionary where each key is a keyword, and the value is a list of indices
    (from doc_list) of the documents containing that keyword

    >>> doc_list = ["The Learn Python Challenge Casino.", "They bought a car and a casino", "Casinoville"]
    >>> keywords = ['casino', 'they']
    >>> multi_word_search(doc_list, keywords)
    {'casino': [0, 1], 'they': [1]}
    """
    d = {keyword: [] for keyword in keywords}

    for idx,doc in enumerate(doc_list):
        for wd in doc.split():
            for keyword in keywords:
                if wd.lower().rstrip(',.?') == keyword:
                    d[keyword].append(idx)
                    break

    return d
Working with External Libraries
importとdir``helpといったなにかと便利な機能の紹介。
TensorFlowのところは難しい。ので無視してしまった![]()
Exercise: Working with External Libraries
Q1はget_graphの戻り値がmatplotlib.pyplotのaxesオブジェクトを返しているので、いろいろとメソッドが使える。
kaggle - Matplot Tutorial for Everyoneとかで別に勉強しないと、ここだけではかなり辛い。
def prettify_graph(graph):
    """Modify the given graph according to Jimmy's requests: add a title, make the y-axis
    start at 0, label the y-axis. (And, if you're feeling ambitious, format the tick marks
    as dollar amounts using the "$" symbol.)
    """
    graph.set_title("Results of 500 slot machine pulls")
    # Complete steps 2 and 3 here
    graph.set_ylim(bottom=0)
    graph.set_ylabel('Balance')

# https://matplotlib.org/stable/gallery/ticks_and_spines/tick-formatters.html
# This is enough
    graph.yaxis.set_major_formatter('${x:0.0f}')

# https://stackoverflow.com/questions/63723514/userwarning-fixedformatter-should-only-be-used-together-with-fixedlocator
# https://matplotlib.org/stable/api/_as_gen/matplotlib.axes.Axes.set_yticklabels.html#matplotlib.axes.Axes.set_yticklabels
#    yticks_list = graph.get_yticks().tolist()
#    print(yticks_list)
#    [0.0, 50.0, 100.0, 150.0, 200.0, 250.0, 300.0, 350.0]
#     new_labels = [f'${x:.0f}' for x in yticks_list]
#     graph.set_yticks(yticks_list)
#     graph.set_yticklabels(new_labels)

graph = jimmy_slots.get_graph()
prettify_graph(graph)
graph
この問題は、回答が古い使い方をしていてwarningがでます。
コメントアウトしているのが、修正したやり方。
でも、set_major_formatterを使うと一発で変換できます。
Q3は、まず貰い物
def blackjack_hand_greater_than(hand_1, hand_2):
#     In case of draw, hand_2 wins anyway.
     return blackjack_hand_value(hand_1) > blackjack_hand_value(hand_2)

def blackjack_hand_value(hand):
 #     Evaluate all cards, ignore aces for one and count them as 10s
     evaluate = lambda x: int(x) if x.isdigit() else 10
     ace_count = hand.count('A')
 #     We assume all aces count as 11 at the beginning
     value = sum([evaluate(c) for c in hand]) + ace_count
 #     Lower ace value if value exceeds 21 and it's possible
     while ace_count > 0 and value > 21:
         ace_count-=1
         value-=10
 #     If hand value exceeds 21 count it as 0 (or any other low value not possible in blackjack)
     return value if value <= 21 else 0
これはevaluteのところが美しい。あと、ブタの判定をblackjack_hand_value側でやっているので、勝ち負け判定のところがシンプルになっているのがいいです。
自分のは
def blackjack_hand_greater_than(hand_1, hand_2):
    """
    Return True if hand_1 beats hand_2, and False otherwise.

    In order for hand_1 to beat hand_2 the following must be true:
    - The total of hand_1 must not exceed 21
    - The total of hand_1 must exceed the total of hand_2 OR hand_2's total must exceed 21

    Hands are represented as a list of cards. Each card is represented by a string.

    When adding up a hand's total, cards with numbers count for that many points. Face
    cards ('J', 'Q', and 'K') are worth 10 points. 'A' can count for 1 or 11.

    When determining a hand's total, you should try to count aces in the way that
    maximizes the hand's total without going over 21. e.g. the total of ['A', 'A', '9'] is 21,
    the total of ['A', 'A', '9', '3'] is 14.

    Examples:
    >>> blackjack_hand_greater_than(['K'], ['3', '4'])
    True
    >>> blackjack_hand_greater_than(['K'], ['10'])
    False
    >>> blackjack_hand_greater_than(['K', 'K', '2'], ['3'])
    False
    """

    def hands_total(hand):

        hand = sorted(hand, key=lambda x: x.isdigit(), reverse=True)
        #  print(hand)
        #  sort order
        #  ['1', '10', '2', '3', '4', '5', '6', '7', '8', '9', 'J', 'K', 'Q', 'A']
        r = 0
        cards = ['10','J','Q','K']

        for h in hand:
            if h in cards:
                r += 10
            else:
                r += int(h,16) + (h == 'A')
                if r > 21 and h == 'A':
                    r -= 10
        return r

    r1, r2 = hands_total(hand_1), hands_total(hand_2)

    return r1 <= 21 and (r1 > r2 or r2 > 21)
_A_って16進数だと10じゃん で作ってみたコード。
r += int(h,16) + (h == 'A')のところが、Trueは1でFalseは0の応用になっています。
まとめ
- kaggleのPython courseはPythonを使ったことがない人でもとりあえず使えるようになるいいコースだと思います。
- 当たり前だけど、これだけだとわかりづらいことも多数あるので本家Python 標準ライブラリで調べたりVISUALIZE CODE EXECUTIONで実際のコードの動きを確認するといいと思います。
- この他にも機械学習についてもコースがいろいろあるので試してみるといいと思います。
pythonの話だけですね![]()