つくってみた
|makeresults count=3
| streamstats count as x
| eval y=mvrange(1,4)
| chart list(y) as y by x
| mvexpand y
| streamstats count(x) as z
| x | y | z |
|---|---|---|
| 1 | 1 | 1 |
| 1 | 2 | 2 |
| 1 | 3 | 3 |
| 2 | 1 | 4 |
| 2 | 2 | 5 |
| 2 | 3 | 6 |
| 3 | 1 | 7 |
| 3 | 2 | 8 |
| 3 | 3 | 9 |
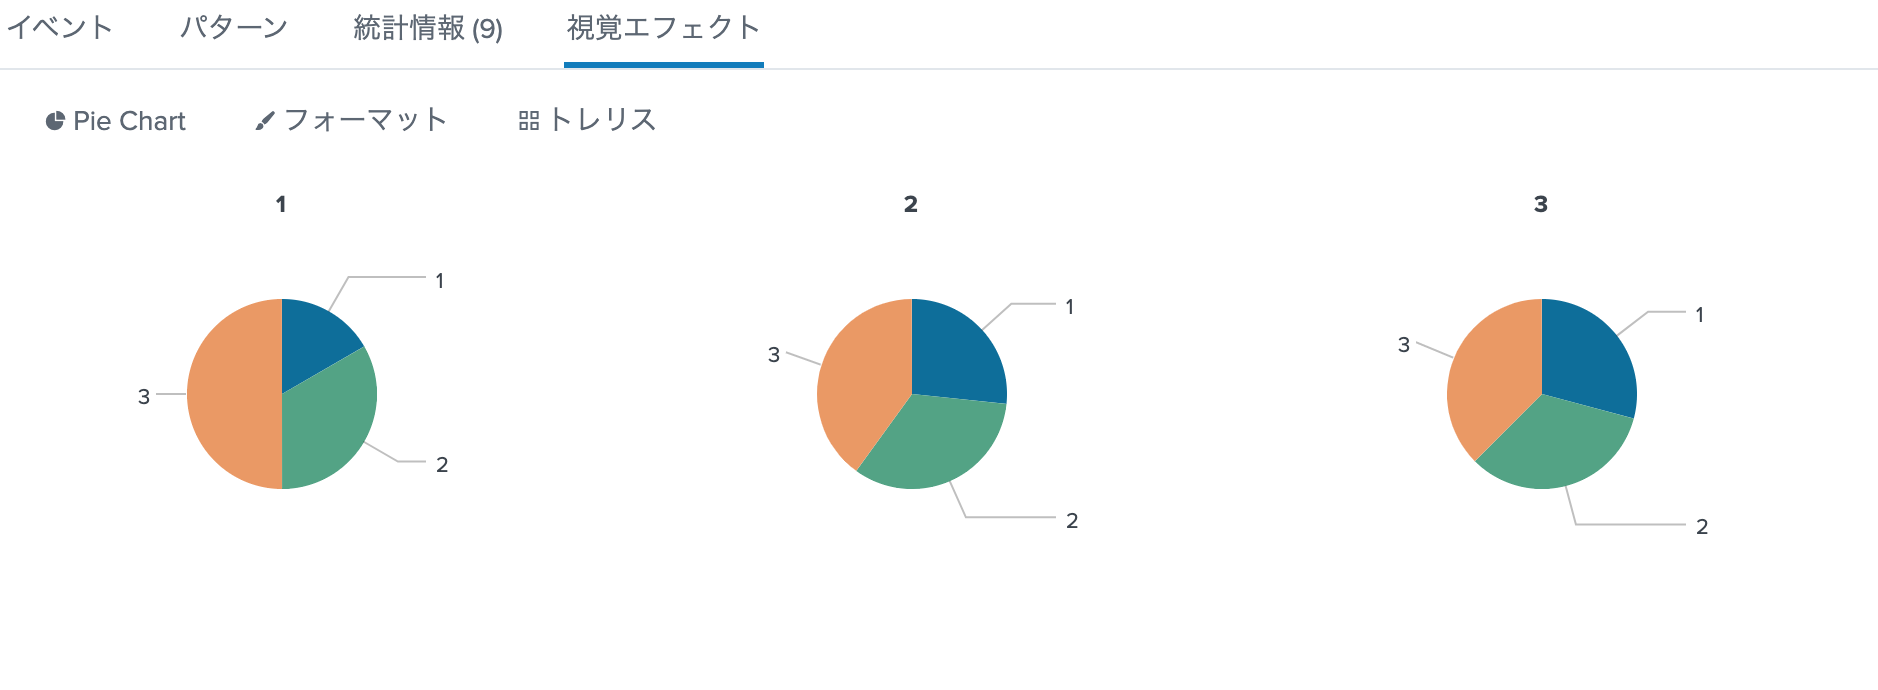
トレリス表示の不思議なところが、chartを使用しないで同じ表を作ってもダメなところ。
また基準のxはchartの前で整形しなければならない。
evalでchartのあとでいろいろやってしまうとトレリス表示ができなくなる。
もっと細かく
|makeresults count=3
| eval x=mvrange(1,4)
| eval y=mvrange(1,10)
| chart list(y) as y by x
| mvexpand y
| eval  z=1
count=3 * mvrang(1,4)=3 * mvrange(1,10)=9 の行ができる。
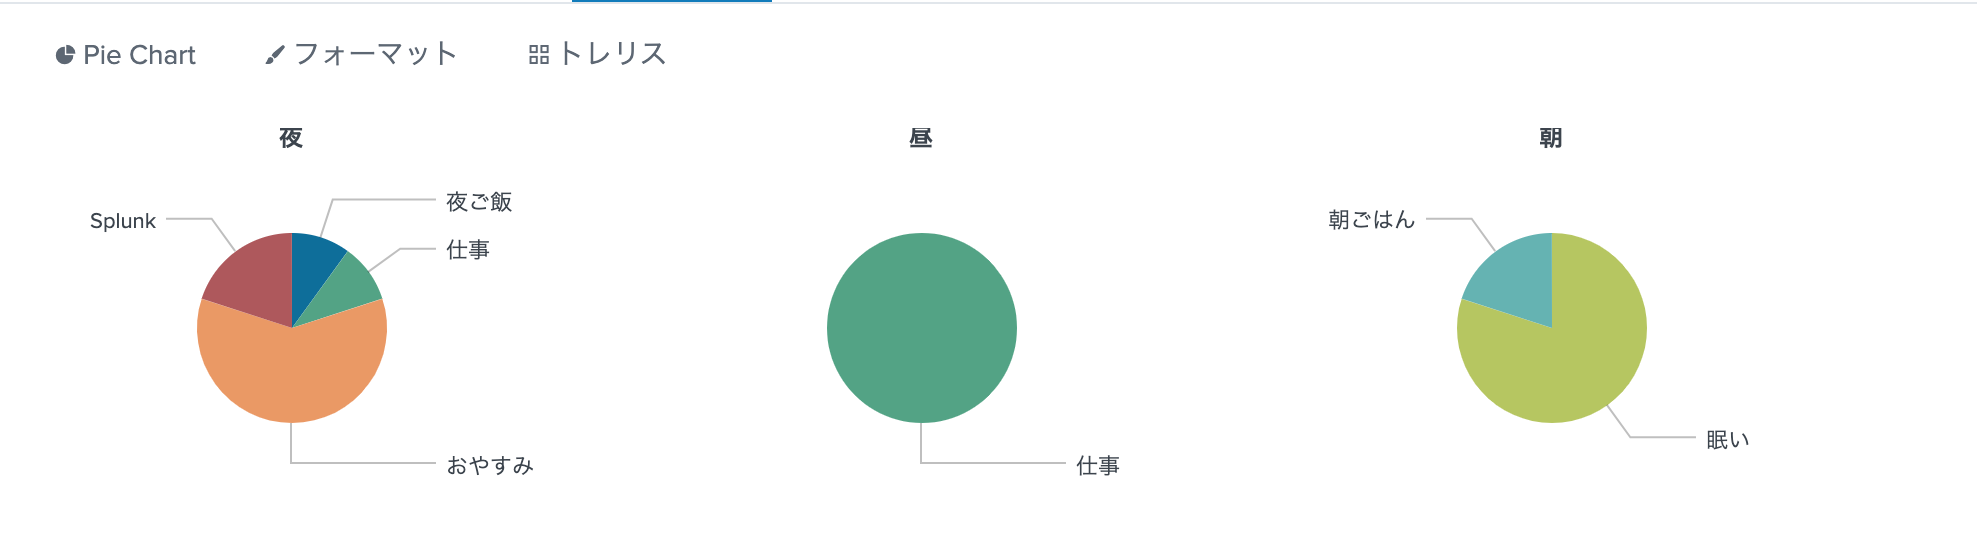
こんな感じ
|makeresults
| eval x=split("朝#昼#夜","#")
| eval y=split("眠い,朝ごはん,仕事,夜ご飯,Splunk,おやすみ",",")
| stats values(y) as y by x
| eval y=case(x="夜",mvindex(y,0,3),x="昼","仕事",x="朝",mvindex(y,4,-1))
| mvexpand y
| streamstats count as z
| eval z = case(z=1,20,z=2,60,z=3,10,z=4,10,z=5,100,z=6,20,z=7,80)
Line Chart
index=_internal
| timechart span=1m count by sourcetype
| addcoltotals labelfield=_time label=total
| transpose 0 header_field=_time
| where total >100
| transpose 0 column_name=_time header_field=column
| where _time!="total"
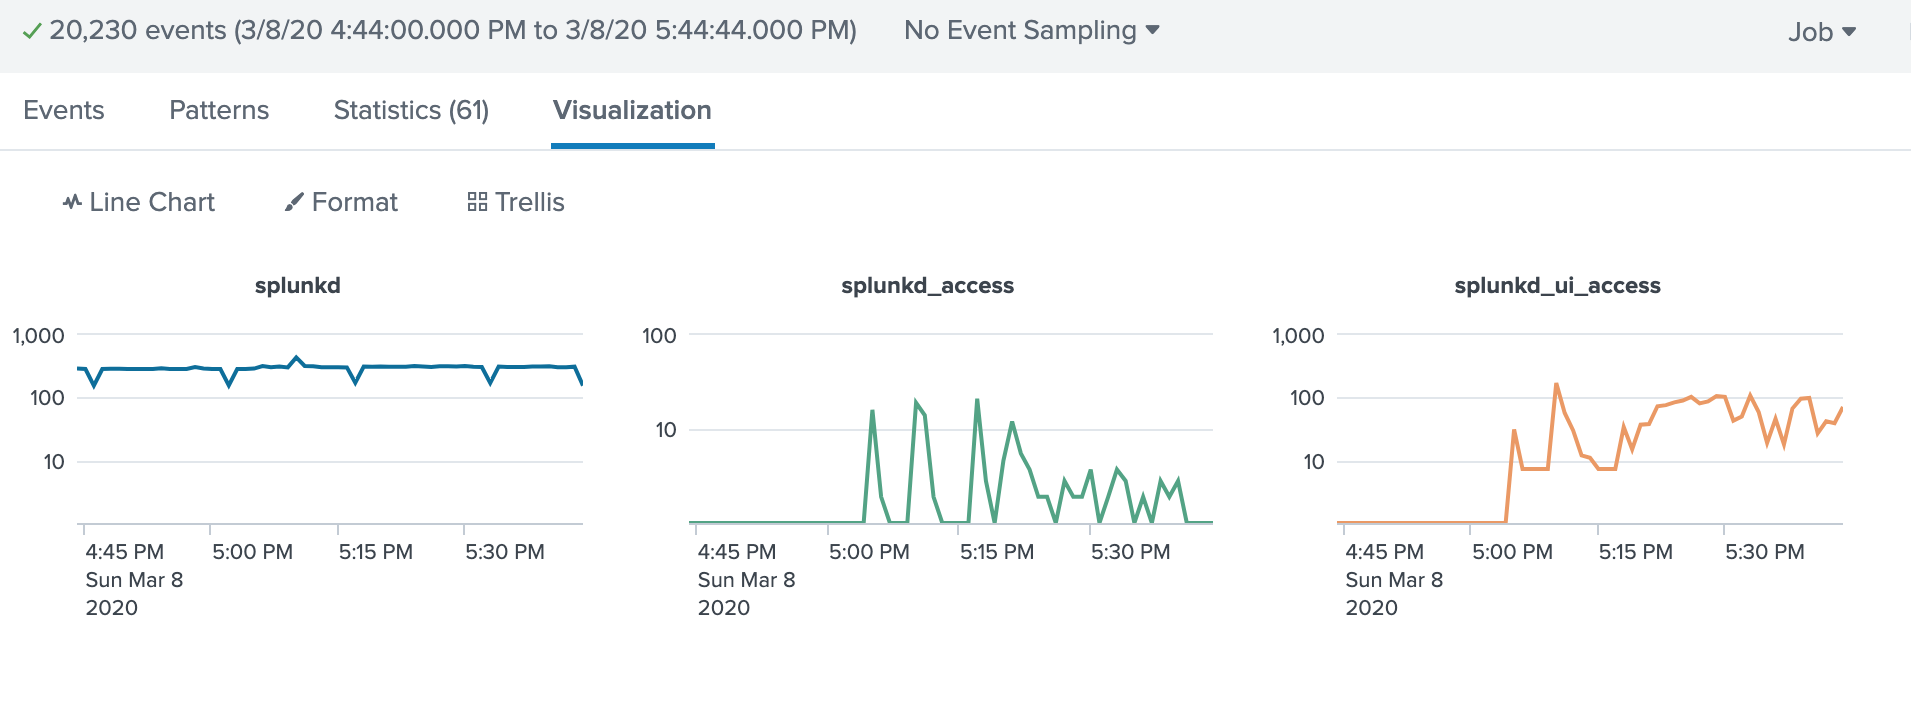
これでもトレリス表示できた。
クエリーは合計が100以下の場合表示したくないな〜と思って
addcoltotals ⇨ 縦横変換 ⇨ where ⇨ 縦横変換 してみた。
なお
index=_internal
| eventstats count by sourcetype
| where count > 100
| timechart span=1m count by sourcetype
との比較は
| command | search time |
|---|---|
| transpose | 0.443 seconds |
| eventstats | 0.912 seconds |
addcoltotalsの検索コストが全然かかっていないのに、eventstatsの検索コストが高いのがこの結果に。
トレリスの後に計算したい時
transposeを使用して一旦縦横変換して計算してから戻してやると_Trellis_表記で表示が可能みたいです。
timechartで2つ以上のフィールドでトレリス
index=_internal sourcetype=splunkd
 | bin _time span=5min
 | stats count by _time component log_level
 | eval {log_level}=count
 | fields - log_level count
| _time | component | ERROR | INFO | WARN |
|---|---|---|---|---|
| 2020/05/13 14:00:00 | ExecProcessor | 1 | ||
| 2020/05/13 14:00:00 | LMStackMgr | 14 | ||
| 2020/05/13 14:00:00 | Metrics | 1232 | ... |
心の師匠のクエリー
statsで集計しておいて、複数表示したいフィールド(この場合はlog_lebel)の値をフィールド名とした集計値を作ってあげることで、トレリス表示が可能となる。
すごいや![]()
index=_internal sourcetype=splunkd
| timechart count(eval(log_level="INFO")) as INFO  count(eval(log_level="WARN")) as WARN count(eval(log_level="ERROR")) as ERROR by component
_trellis_表示すると一緒の表示になるクエリー
ただし、統計情報の結果は
| time | ERROR: BucketMover | ERROR: CsvDataProvider | ERROR: DatabaseDirectoryManager | ERROR: ExecProcessor | ERROR: LMStackMgr | ERROR: Metrics | ERROR: OTHER | ERROR: PeriodicHealthReporter | ERROR: PipelineComponent | ERROR: SearchAssistant | ERROR: spatial:PointInPolygonIndex | INFO: BucketMover | INFO: CsvDataProvider | INFO: DatabaseDirectoryManager | INFO: ExecProcessor | INFO: LMStackMgr | INFO: Metrics | INFO: OTHER | INFO: PeriodicHealthReporter | INFO: PipelineComponent | INFO: SearchAssistant | INFO: spatial:PointInPolygonIndex | WARN: BucketMover | WARN: CsvDataProvider | WARN: DatabaseDirectoryManager | WARN: ExecProcessor | WARN: LMStackMgr | WARN: Metrics | WARN: OTHER | WARN: PeriodicHealthReporter | WARN: PipelineComponent | WARN: SearchAssistant | WARN: spatial:PointInPolygonIndex |
|---|---|---|---|---|---|---|---|---|---|---|---|---|---|---|---|---|---|---|---|---|---|---|---|---|---|---|---|---|---|---|---|---|---|
| 2020/05/30 07:00:00 | 0 | 0 | 0 | 0 | 0 | 0 | 0 | 0 | 0 | 0 | 0 | 0 | 0 | 0 | 0 | 67 | 6386 | 0 | 672 | 0 | 0 | 0 | 0 | 0 | 0 | 0 | 0 | 0 | 0 | 0 | 1 | 0 | 0 |
| 2020/05/30 07:30:00 | 0 | 0 | 0 | 0 | 0 | 0 | 0 | 0 | 0 | 0 | 0 | 6 | 0 | 8 | 1 | 53 | 4999 | 0 | 532 | 0 | 0 | 0 | 0 | 0 | 0 | 0 | 0 | 0 | 0 | 0 | 1 | 0 | 0 |
| となっていて、だいぶ違う。 |
https://docs.splunk.com/Documentation/Splunk/latest/SearchReference/Timechart
には
Syntax: sep=<string>
Description: Used to construct output field names when multiple data series are used in conjunctions with a split-by field. This is equivalent to setting format to $AGG$<sep>$VAL$.
と書かれているので、自動的にVAL(値)と判断して表示してくれているみたい。
その2のxyseriesも同じ原理だと思う。 ![]() 集計と値、逆じゃないかな・・・
集計と値、逆じゃないかな・・・
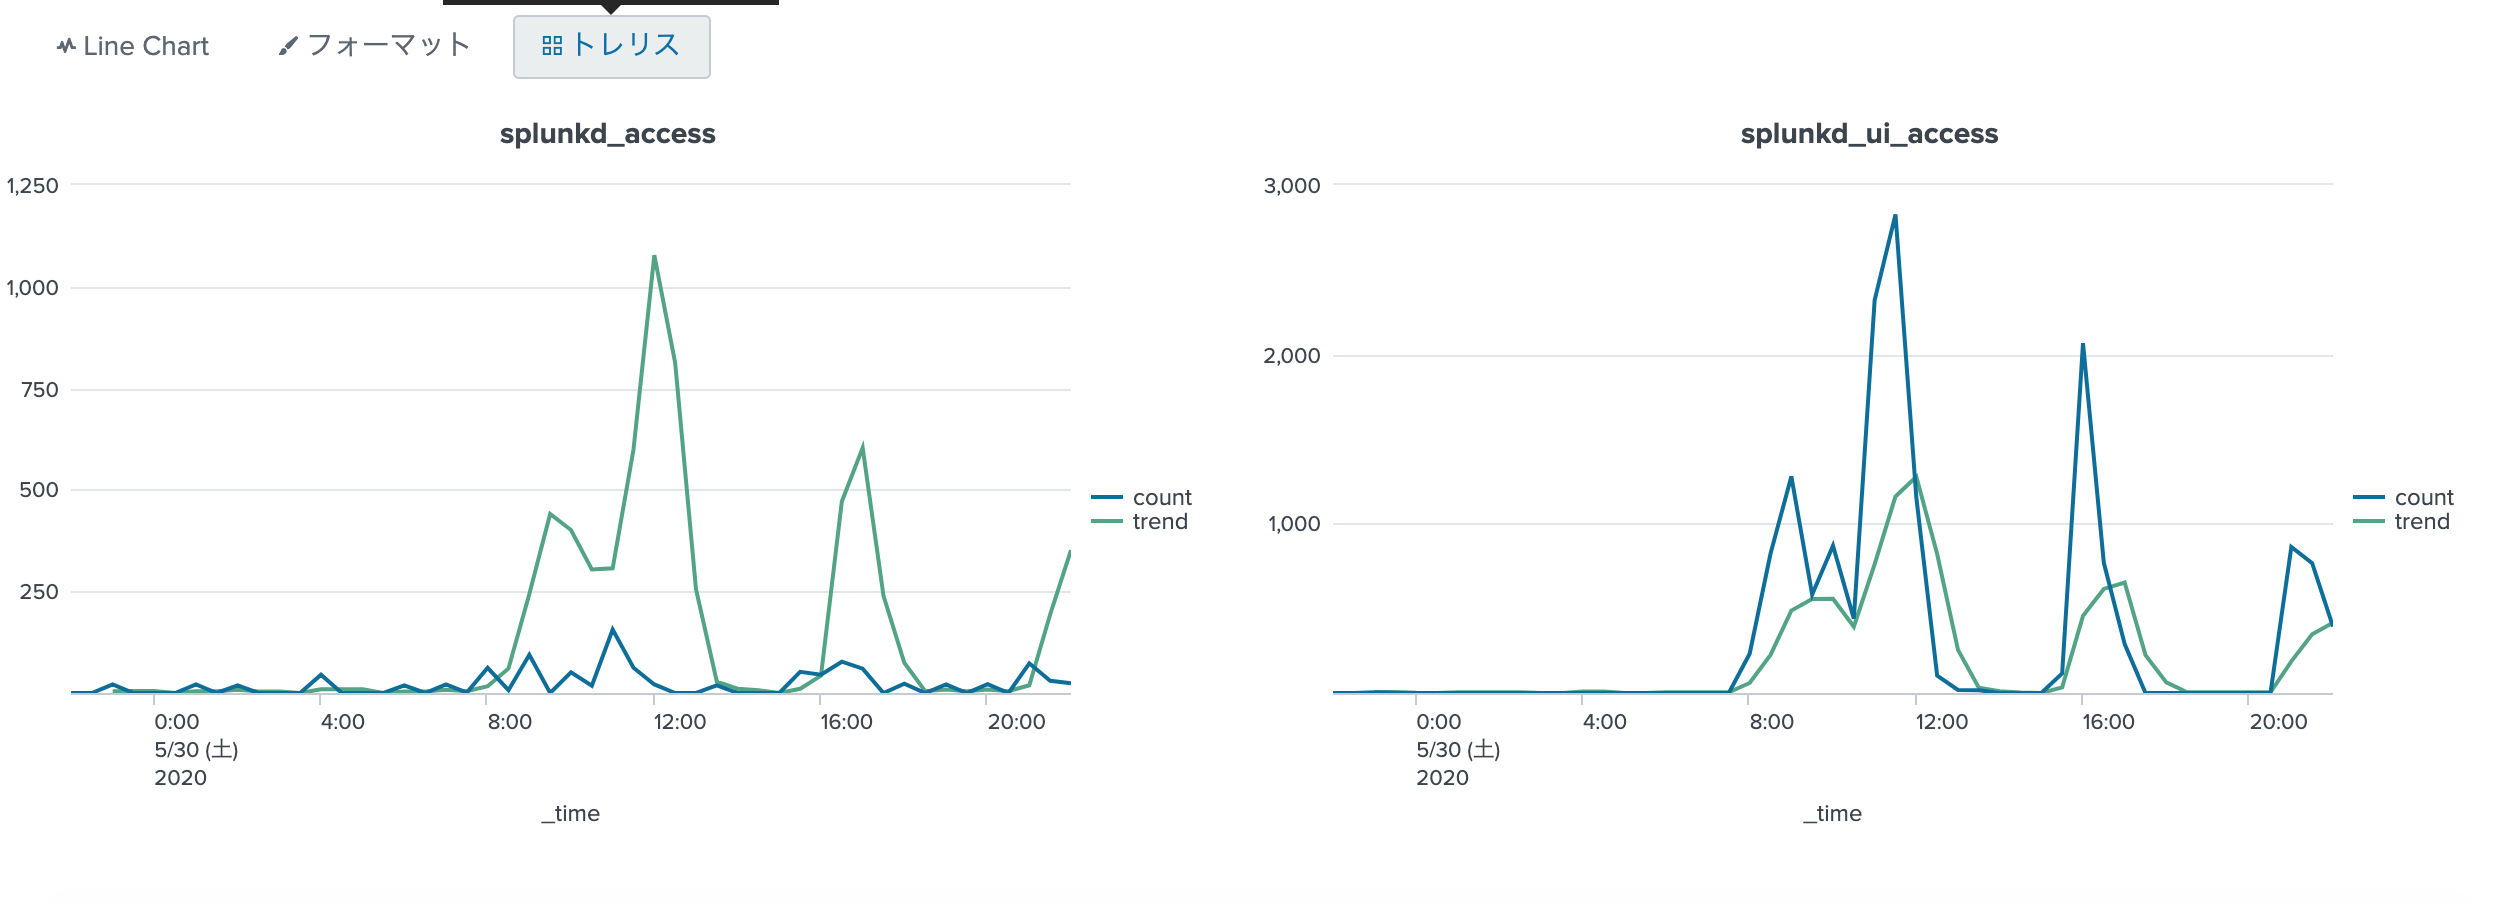
その2
index=_internal sourcetype=splunkd_*
| timechart count by sourcetype
| untable _time sourcetype count
| streamstats global=f avg(count) as trend window=5 by sourcetype
| xyseries _time sourcetype count trend
| _time | count: splunkd_access | count: splunkd_ui_access | trend: splunkd_access | trend: splunkd_ui_access |
|---|---|---|---|---|
| 2020/05/30 06:00:00 | 19 | 0 | ||
| 2020/05/30 06:30:00 | 0 | 0 | ||
| 2020/05/30 07:00:00 | 21 | 0 | 8.0 | 4.2 |
| 2020/05/30 07:30:00 | 1 | 0 | 4.4 | 4.4 |
| 2020/05/30 08:00:00 | 62 | 232 | 16.8 | 59.0 |
| 2020/05/30 08:30:00 | 7 | 822 | 60.4 | 224.6 |
| 2020/05/30 09:00:00 | 94 | 1279 | 243.4 | 486.8 |
| 2020/05/30 09:30:00 | 0 | 581 | 440.4 | 555.2 |
この結果は少しびっくりしていて、 xyseriesで作ったフィールド名は count: splunkd_accessなんだけど、_trellis_表示だと、綺麗にわかれて表示してくれる。
今回は~~trendline~~ (複数フィールドだと上手く動いていないのでstreamstatsに変更) を使ったけど、eventstatsも使えるからなにかと使えると思う。
index=_internal sourcetype=splunkd_*
| timechart count by sourcetype
| trendline sma5(splunkd_access) as "trend: splunkd_access" sma5(splunkd_ui_access) as "trend: splunkd_ui_access"
| untable _time sourcetype count
| eval trend=if(match(sourcetype,"trend"),count,NULL), count = nullif(count,trend)
| eval sourcetype=trim(sourcetype,"trend: ")
| selfjoin _time sourcetype
| stats values(*) as * by _time sourcetype
trendlineは*が使えなかったので、こんな感じになった。![]() めんどくさい
めんどくさい
応用
| _time | sourcetype | count | trend |
|---|---|---|---|
| 2020/05/31 06:30:00 | splunkd_ui_access | 239 | 102.6 |
| 2020/05/31 06:30:00 | splunkd_access | 1 | 54.8 |
| 2020/05/31 06:00:00 | splunkd_ui_access | 214 | 54.6 |
| 2020/05/31 06:00:00 | splunkd_access | 59 | 11.8 |
| 2020/05/31 05:30:00 | splunkd_ui_access | 0 | 0.0 |
| 2020/05/31 05:30:00 | splunkd_access | 0 | 0.0 |
| 2020/05/31 05:00:00 | splunkd_ui_access | 0 | 0.0 |
| 2020/05/31 05:00:00 | splunkd_access | 0 | 0.2 |
xyseriesの前の結果がこれなので、
1: _trellis_表示を使いたいフィールドをstatsのbyで集計
2: untableして、eventstatsとかtrendlineとかで別な集計を実施
3: フィールドの構成は
| col1 | col2 | col3 | col4 | ... |
|---|---|---|---|---|
| _time | trellis表示したいフィールド | 集計1 | 集計2 | ... |
4: xyseriesで取りまとめる。 |
||||
構文はxyseries col1 col2 col3 col4 ...
|
||||
| 5: _col2_で_trellis_表示をすると綺麗に表示される。 |
まとめ
トレリス表示のときは
| x | y | z |
|---|---|---|
| トレリスの基準 | 表示項目 | 割合 |
| になります。 | ||
xとyをstatsやchartで作成すれば、zは適当でいいので、 |
||
今回みたく数字で作っておいてreplace()とかで調整して、list()やvalues()で表示させてやると思った通りのトレリス表示になりそうです。 |
![]() 実例でやれてないです。
実例でやれてないです。
R2.3.8 Line Chartを追記
R2.5.14 timechartで2つ以上のフィールドでトレリスを追記
R2.5.31 timechartで2つ以上のフィールドでトレリスその2を追記