.conf 2020 (https://https://conf.splunk.com/) のBreakdownSession
TRU1276C - Splunk Dashboard Journey: Past Present and Future
セッションビデオとpdf
で紹介されたItsy Bitsy App for Splunkについて調べてみる。
Itsy Bitsy
https://ejje.weblio.jp/content/Itsy+Bitsy
ちっぽけな という意味(じゃないよね ![]() )
)
README
Copyright 2020 Splunk Inc.

これは、CSS と JS 拡張機能とカスタム ビジュアライゼーションを使ったシンプルな XML 機能の一部をデモするために作成されたアプリです。
使用しているデータはほとんどがSplunkの index=_internal から作成されたもので、デモのみを目的としています。

default/data/ui/
    nav
        default.xml - アプリのナビゲーションは4つのダッシュボードのみを表示し、アプリにテーマカラーを与えます。
    views
        overall_health.xml - しきい値チャートを開くためのドリルダウン機能を備えた、要素とサービスのヒートマップとサービスツリービュー。
        health_comparison.xml - 凡例の系列比較にCSSをオーバーライドしたSimpleXMLのチャートを使用したダッシュボード。
        service_flow.xml - ダッシュボードにデータアイコンとカラーを含む画像オーバーレイ用のSimpleXMLでCSS拡張機能を追加しました。
        advanced_view.xml - SimpleXMLにおいてCSSとJavaScriptでモーダルウィンドウのチャートや表を使うための高度なダッシュボード.
    panels
        pp_SplunkNavBarTabView.xml - ダッシュボードメニューがタブとして表示されるようにCSSを上書きするための構築済みパネル(dashboard.cssに移動する必要があります。)
appserver/static/
    scripts
        advanced_model.js - SplunkJSのコードを使ったSimple XML JS拡張用JavaScript
        table_with_tooltip.js -  テーブルヒートマップのツールチップとテーブルタイルアイコンの切り替えに必要なJavaScript
    imges
        svg
            online_shopping_design.svg - SVG background image for Glass Table Dashboard for Image Overlay.
            conf20-nav-logo.svg - SVG logo for Splunk conf20.
        png
            dashboard-background.png - PNG background image for image overlay example.

Dependencies:
    Status Indicator Custom Viz - Used for Font-Awesome Icons - https://splunkbase.splunk.com/app/3119/
    Region Chart viz - Drilldown chart with thresholds - https://splunkbase.splunk.com/app/4911/
    Network Diagram Viz - For plotting Service dependency - https://splunkbase.splunk.com/app/4438/
日本語は DeepLに放り込んだそのままです。
SVG

と
 の2つ
の2つ
default.xml
<!-- Copyright 2020 Splunk Inc. -->
<nav search_view="search" color="#0072C6">
  <view name="overall_health" default="true"/>
  <view name="health_comparison"/>
  <view name="service_flow"/>
  <view name="advanced_view"/>
</nav>
color="#0072C6"ってどこかなと思ったら
の蜘蛛のバックグランドの色だった。
pp_SplunkNavBarTabView.xml
/default/data/ui/panels/配下にある。
<!-- Copyright 2020 Splunk Inc. -->
<panel>
  <html>
        <style>
          /* Splunk Navigation Tab View CSS Style - START */
          /* Should be moved to dashboard.css to apply for entire App */
          div[data-view="views/shared/appbar/AppNav"]{
              padding-top: 10px;
              padding-left: 10px;
          }
          a[data-view="views/shared/appbar/Button"]{
            width: 200px !important;
            border-top-color: #E1E6EB;
            border-top-style: solid;
            border-top-width: 1px;
            border-right-color: #E1E6EB;
            border-right-style: solid;
            border-right-width: 1px;
            border-left-color: #E1E6EB;
            border-left-style: solid;
            border-left-width: 1px;
          	border-top-left-radius: 10px;
            border-top-right-radius: 10px;
          }
          /* Tab View CSS Style - END */
        </style>
      </html>
</panel>
最初のdivは

の緑色のところ。結構見つけるのが大変だった。
次のdivは角ボタンを角を丸くしてCSSで記述している。
参考: https://developer.mozilla.org/ja/docs/Web/CSS/border-top-left-radius
overall_health.xml
デフォルトのダッシュボード。長いので折り畳み
<!-- Copyright 2020 Splunk Inc. -->
<form hideSplunkBar="true" hideTitle="true" theme="dark" script="/scripts/table_with_tooltip.js">
<label>Overall Health</label>
<init>
<!-- Initialize tokens -->
<!-- Max 250 rows in table -->
<set token="tokHosts">250</set>
<!-- token to refresh table using Search dependency. This updates the table render through JS -->
<set token="tokRefresh">1</set>
<!-- Set Font Awesome icon for Desktop -->
<set token="ICON_COMPUTER">desktop️️</set>
</init>
<fieldset submitButton="false" autoRun="true"></fieldset>
<row depends="$alwaysHideCSSStyleOverride$">
<!-- Pre Built Panel has the CSS for all dashboards in the App. It converts Dashboard Navigation menu to Tab. Should be moved to dashboard.js -->
<panel ref="pp_SplunkNavBarTabView"></panel>
<panel>
<html>
<style>
/* START - Bring Radio Options to Same Line */
#panel_fieldset #link_size.input-link{
width: 380px;
}
#panel_fieldset #radio_sort_field div[data-component="splunk-core:/splunkjs/mvc/components/RadioGroup"]{
display: -webkit-box;
}
#panel_fieldset #radio_sort_field.input-radio{
width: 240px !important;
}
/* END - Bring Radio Options to Same Line */
/* START - Tab View CSS Style */
#panel_layout .fieldset{
padding: 10px 12px 0px 12px !important;
}
#input_link_tab1.input-link{
width: 440px !important;
}
#input_link_tab1 label{
display:none !important;
}
#input_link_tab1.input-link div[data-component="splunk-core:/splunkjs/mvc/components/LinkList"]{
display: -webkit-box !important;
}
#input_link_tab1.input-link button{
width: 120px !important;
border-top-color: #E1E6EB;
border-top-style: solid;
border-top-width: 1px;
border-right-color: #E1E6EB;
border-right-style: solid;
border-right-width: 1px;
border-left-color: #E1E6EB;
border-left-style: solid;
border-left-width: 1px;
border-top-left-radius: 10px;
border-top-right-radius: 10px;
}
.dashboard-panel #input_link_split_by label,
#input_link_tab1 .splunk-choice-input-message{
display: none !important;
}
#html_tab_hr hr{
height:1px;
border-width:0;
color: black;
background-color: #E1E6EB;
margin: 0px;
}
#html_tab_hr .panel-body.html{
padding: 0px !important;
}
/* END - Tab View CSS Style */
/* START - Table as Tile CSS Style Override */
#table_tile div#statistics.results-table {
overflow-y: auto !important;
height: 420px !important;
padding-left: 5px !important;
}
#table_tile table tbody{
display:flex;
flex-wrap: wrap;
}
#table_tile table th{
display: none !important;
}
#table_tile table tbody tr{
margin-right:10px;
margin-bottom:10px;
}
#table_tile table tbody tr td{
width: $tokTileWidth$;
text-align: center;
display: grid;
color: #fff !important;
font-weight: bold;
}
#table_tile table tbody tr td div[data-mv-index="0"].multivalue-subcell{
display:none;
}
#table_tile table tbody tr td div[data-mv-index="1"].multivalue-subcell{
margin-top: $tokIconTopPadding$;
font-size: $tokIconFontSize$;
}
#table_tile table tbody tr td div[data-mv-index="2"].multivalue-subcell{
margin-top: $tokIconTopPadding$;
font-size: $tokLabelFontSize$;
display: $tokHideHost$;
}
#table_tile table tbody tr td div[data-mv-index="3"].multivalue-subcell{
margin-top: $tokLabelTopPadding$;
font-size: $tokLabelFontSize$;
display: $tokHideKPI$;
}
/* END - Table as Tile CSS Style Override */
/* START - Table Tile Tooltip Style */
#table_tile td.custom-tooltip-cell div.tooltip-inner{
font-size:120%;
font-weight: bold;
}
#table_tile td.custom-tooltip-cell.critical div.tooltip-inner{
color: #DC4E41;
}
#table_tile td.custom-tooltip-cell.severe div.tooltip-inner{
color: #F1813F;
}
#table_tile td.custom-tooltip-cell.medium div.tooltip-inner{
color: #F8BE34;
}
#table_tile td.custom-tooltip-cell.normal div.tooltip-inner{
color: #B6C75A;
}
#table_tile td div i.fa.fa-desktop️️:before {
content: "\f108";
}
#table_tile td div i.fa-floppy-o:before {
content: "\f0c7";
}
#table_tile td div i.fa-hdd-o:before {
content: "\f0a0";
}
/* END - Table Tile Tooltip Style*/
/* Move Hide Chart Link inputs to Right */
#linkHideServerDetails,
#linkHideServiceDetails{
float: right;
}
</style>
</html>
</panel>
</row>
<row>
<panel id="panel_layout">
<!-- Link input as tab using SimpleXML CSS extension -->
<input id="input_link_tab1" type="link" token="tokLinkTab" searchWhenChanged="true">
<label></label>
<choice value="entity">Entity</choice>
<choice value="service">Sevice</choice>
<default>entity</default>
<change>
<condition value="entity">
<set token="showEntity">true</set>
<unset token="showService"></unset>
<unset token="tokService"></unset>
</condition>
<condition value="service">
<unset token="showEntity"></unset>
<set token="showService">true</set>
<unset token="tokServer"></unset>
</condition>
</change>
</input>
<html id="html_tab_hr">
<!-- Horizontal Line below the tab links -->
<hr/>
</html>
<!-- Status Indicator Custom Visualization added for Table Icons using Font Awesome -->
<viz depends="$alwaysHideStatuIndicatorUsedForFontAwesomeIcons$" type="status_indicator_app.status_indicator">
<search>
<query/>
</search>
</viz>
</panel>
</row>
<row>
<panel depends="$showEntity$">
<title>Entity View</title>
<table id="table_tile">
<!-- Run anywhere search to generate row of Host, CPU, icon and Threshold as multivalue cell -->
<search depends="$showEntity$">
<query>| makeresults count=$tokHosts$
| fields - _time
| streamstats count as sno
| eval host="host".sno
| fields - sno
| eval cpu=substr(tostring(random()),1,2)
| eval _cpu_kpi_threshold=case(cpu>=0 AND cpu<40,"normal",
cpu>=40 AND cpu<80,"medium",
cpu>=80 AND cpu<90,"severe",
true(),"critical"
)
| eval _cpu=cpu
| eval server=_cpu_kpi_threshold."|$ICON_COMPUTER$|".host."|".cpu."%"
| makemv server delim="|"
| sort $tokSortField$
| eval _host=host
| fields - host cpu "$tokRefresh$"</query>
<earliest>-1s</earliest>
<latest>now</latest>
</search>
<option name="count">$tokHosts$</option>
<option name="refresh.display">progressbar</option>
<!-- Apply table color formatting based on expression -->
<format type="color" field="server">
<colorPalette type="expression">if (match(value,"critical"), "#DC4E41", if(match(value,"severe"),"#F1813F", if(match(value,"medium"),"#F8BE34","#B6C75A")))</colorPalette>
</format>
<!-- Set required tokens on drilldown -->
<drilldown>
<set token="tokServer">$row._host$</set>
<set token="tokCPU">$row._cpu$</set>
<set token="tokCPUThreshold">$row._cpu_kpi_threshold$</set>
</drilldown>
</table>
</panel>
<panel depends="$showService$">
<title>Service View (double click for details) - Network Diagram Viz</title>
<viz type="network-diagram-viz.network-diagram-viz">
<!-- Run anywhere search to build "from" and "to" service mapping with threshold count and color -->
<search depends="$showService$">
<query>| makeresults
| eval data=" ,Buttercup Store,cloud;Buttercup Store,Web Front End,server;Buttercup Store,Web Mobile App,server;Web Mobile App,Catalog Service,server;Web Mobile App,Cart Service,server;Catalog Service,Cloud Database,server;Cart Service,Cloud Database,database;Web Front End,Cart Service,shopping-cart;Cart Service,Authorization,server;Authorization,On-Prem Database,database;"
| makemv data delim=";"
| mvexpand data
| makemv data delim=","
| eval to=mvindex(data,0), from=mvindex(data,1), type=mvindex(data,2)
| makemv data
| table from to type linktext
| eval count=substr(tostring(random()),1,2)
| eval color=case(count>=0 AND count<30, "#DC4E41",
count>=30 AND count<60, "#F1813F",
count>=60 AND count<75, "#F8BE34",
true(),"#B6C75A")
| eval value=from." (Service Health: ".count."%)"</query>
<earliest>$earliest$</earliest>
<latest>$latest$</latest>
</search>
<option name="drilldown">all</option>
<option name="height">520</option>
<option name="network-diagram-viz.network-diagram-viz.arrowLocation">end</option>
<option name="network-diagram-viz.network-diagram-viz.canZoom">false</option>
<option name="network-diagram-viz.network-diagram-viz.clusterBy">none</option>
<option name="network-diagram-viz.network-diagram-viz.defaultNodeType">server</option>
<option name="network-diagram-viz.network-diagram-viz.draggableNodes">true</option>
<option name="network-diagram-viz.network-diagram-viz.enablePhysics">true</option>
<option name="network-diagram-viz.network-diagram-viz.hierarchy">true</option>
<option name="network-diagram-viz.network-diagram-viz.hierarchyDirection">Bottom-Up</option>
<option name="network-diagram-viz.network-diagram-viz.hierarchySortMethod">directed</option>
<option name="network-diagram-viz.network-diagram-viz.linkTextLocation">bottom</option>
<option name="network-diagram-viz.network-diagram-viz.linkTextSize">medium</option>
<option name="network-diagram-viz.network-diagram-viz.nodeTextSize">medium</option>
<option name="network-diagram-viz.network-diagram-viz.smoothEdgeType">dynamic</option>
<option name="network-diagram-viz.network-diagram-viz.smoothEdges">true</option>
<option name="network-diagram-viz.network-diagram-viz.tokenNode">nd_node_token</option>
<option name="network-diagram-viz.network-diagram-viz.tokenToNode">nd_to_node_token</option>
<option name="network-diagram-viz.network-diagram-viz.tokenToolTip">nd_tooltip_token</option>
<option name="network-diagram-viz.network-diagram-viz.tokenValue">nd_value_token</option>
<option name="refresh.display">progressbar</option>
<!-- Drilldown token for Service Name -->
<drilldown>
<set token="tokService">$nd_node_token$</set>
</drilldown>
</viz>
</panel>
</row>
<row depends="$showEntity$">
<panel id="panel_fieldset">
<input id="link_size" type="link" token="tokTileSize" searchWhenChanged="true">
<label>View Style</label>
<choice value="xsmall">Grid</choice>
<choice value="small">Tile</choice>
<default>xsmall</default>
<!-- CSS style attributes as tokens to change based on table tile Size selectors -->
<change>
<!-- Mimics heatmap view -->
<condition value="xsmall">
<set token="tokIconFontSize">0%</set>
<set token="tokLabelFontSize">initial</set>
<set token="tokTileWidth">8px</set>
<set token="tokHideKPIName">none</set>
<set token="tokHideHost">none</set>
<set token="tokHideKPI">none</set>
</condition>
<!-- Mimics Tile view -->
<condition value="small">
<set token="tokIconFontSize">100%</set>
<set token="tokLabelFontSize">100%</set>
<set token="tokTileWidth">80px</set>
<set token="tokHideKPIName">initial</set>
<set token="tokHideHost">initial</set>
<set token="tokHideKPI">initial</set>
</condition>
</change>
</input>
<!-- Change sorting by Entity name vs Threshold -->
<input id="radio_sort_field" type="radio" token="tokSortField" searchWhenChanged="true">
<label>Sort By</label>
<choice value="host">Entity</choice>
<choice value="- cpu">KPI (Desc)</choice>
<default>- cpu</default>
</input>
</panel>
</row>
<row depends="$tokServer$">
<panel>
<viz type="region_chart_viz.region_chart_viz">
<title>Host $tokServer$ SLA breaches - Region Chart Viz</title>
<!-- Run anywhere search for finding Threshold breaches for Server KPI -->
<search>
<query>| makeresults count=24
| eval span=3600 , host="$tokServer$"
| accum span
| eval _time=_time-span, "Error%"=substr(tostring(random()),1,2)
| eventstats perc68("Error%") as Perc68 perc75("Error%") as Perc75 perc95("Error%") as Perc95
| eval Perc68=round(Perc68,2),Perc75=round(Perc75,2),Perc95=round(Perc95,2)
| table _time "Error%" Perc68 Perc75 Perc95
| eval regions = "Normal=#98C697,".Perc68.",Warning=#FBD886,".Perc75.",Severe=#F7B48C,".Perc95.",Critical=#EA958D"
| fields - Perc*</query>
<earliest>$earliest$</earliest>
<latest>$latest$</latest>
</search>
<option name="refresh.display">progressbar</option>
<option name="region_chart_viz.region_chart_viz.last_text">hide</option>
<option name="region_chart_viz.region_chart_viz.line_color">#000000</option>
<option name="region_chart_viz.region_chart_viz.line_size">3</option>
<option name="region_chart_viz.region_chart_viz.multi_series">shaded</option>
<option name="region_chart_viz.region_chart_viz.nulls">connect</option>
<option name="region_chart_viz.region_chart_viz.region_opacity">75</option>
<option name="region_chart_viz.region_chart_viz.shadow">20</option>
<option name="region_chart_viz.region_chart_viz.status_dots">show</option>
<option name="region_chart_viz.region_chart_viz.summ_text">hide</option>
<option name="region_chart_viz.region_chart_viz.text_precision">-1</option>
<option name="region_chart_viz.region_chart_viz.text_thousands">no</option>
<option name="region_chart_viz.region_chart_viz.text_unit">%</option>
<option name="region_chart_viz.region_chart_viz.text_unit_position">after</option>
<option name="region_chart_viz.region_chart_viz.type">curve</option>
<option name="region_chart_viz.region_chart_viz.xtitle_show">hide</option>
<option name="region_chart_viz.region_chart_viz.ytitle_show">hide</option>
</viz>
</panel>
</row>
<!-- Hide chart using Link Input -->
<row depends="$tokServer$">
<panel>
<input id="linkHideServerDetails" type="link" token="resetTokenServer" searchWhenChanged="true">
<label></label>
<choice value="clear">Hide Details</choice>
<change>
<condition value="clear">
<unset token="tokServer"></unset>
<unset token="form.resetTokenServer"></unset>
</condition>
</change>
</input>
</panel>
</row>
<row depends="$tokService$">
<panel>
<viz type="region_chart_viz.region_chart_viz">
<title>Host $tokService$ SLA breaches - Region Chart Viz</title>
<!-- Run anywhere search for finding Threshold breaches for Service KPI -->
<search>
<query>| makeresults count=24
| eval span=3600 , host="$tokService$"
| accum span
| eval _time=_time-span, "Error%"=substr(tostring(random()),1,2)
| eventstats perc68("Error%") as Perc68 perc75("Error%") as Perc75 perc95("Error%") as Perc95
| eval Perc68=round(Perc68,2),Perc75=round(Perc75,2),Perc95=round(Perc95,2)
| table _time "Error%" Perc68 Perc75 Perc95
| eval regions = "Normal=#98C697,".Perc68.",Warning=#FBD886,".Perc75.",Severe=#F7B48C,".Perc95.",Critical=#EA958D"
| fields - Perc*</query>
<earliest>$earliest$</earliest>
<latest>$latest$</latest>
</search>
<option name="refresh.display">progressbar</option>
<option name="region_chart_viz.region_chart_viz.last_text">hide</option>
<option name="region_chart_viz.region_chart_viz.line_color">#000000</option>
<option name="region_chart_viz.region_chart_viz.line_size">3</option>
<option name="region_chart_viz.region_chart_viz.multi_series">shaded</option>
<option name="region_chart_viz.region_chart_viz.nulls">connect</option>
<option name="region_chart_viz.region_chart_viz.region_opacity">75</option>
<option name="region_chart_viz.region_chart_viz.shadow">20</option>
<option name="region_chart_viz.region_chart_viz.status_dots">show</option>
<option name="region_chart_viz.region_chart_viz.summ_text">hide</option>
<option name="region_chart_viz.region_chart_viz.text_precision">-1</option>
<option name="region_chart_viz.region_chart_viz.text_thousands">no</option>
<option name="region_chart_viz.region_chart_viz.text_unit">%</option>
<option name="region_chart_viz.region_chart_viz.text_unit_position">after</option>
<option name="region_chart_viz.region_chart_viz.type">curve</option>
<option name="region_chart_viz.region_chart_viz.xtitle_show">hide</option>
<option name="region_chart_viz.region_chart_viz.ytitle_show">hide</option>
</viz>
</panel>
</row>
<!-- Hide chart using Link Input -->
<row depends="$tokService$">
<panel>
<input id="linkHideServiceDetails" type="link" token="resetTokenService" searchWhenChanged="true">
<label></label>
<choice value="clear">Hide Details</choice>
<change>
<condition value="clear">
<unset token="tokService"></unset>
<unset token="form.resetTokenService"></unset>
</condition>
</change>
</input>
</panel>
</row>
</form>
| makeresults count=24
| eval span=3600 , host="$tokService$"
| accum span
| eval _time=_time-span, "Error%"=substr(tostring(random()),1,2)
| eventstats perc68("Error%") as Perc68 perc75("Error%") as Perc75 perc95("Error%") as Perc95
| eval Perc68=round(Perc68,2),Perc75=round(Perc75,2),Perc95=round(Perc95,2)
| table _time "Error%" Perc68 Perc75 Perc95
| eval regions = "Normal=#98C697,".Perc68.",Warning=#FBD886,".Perc75.",Severe=#F7B48C,".Perc95.",Critical=#EA958D"
| fields - Perc*
| makeresults
| eval data=" ,Buttercup Store,cloud;Buttercup Store,Web Front End,server;Buttercup Store,Web Mobile App,server;Web Mobile App,Catalog Service,server;Web Mobile App,Cart Service,server;Catalog Service,Cloud Database,server;Cart Service,Cloud Database,database;Web Front End,Cart Service,shopping-cart;Cart Service,Authorization,server;Authorization,On-Prem Database,database;"
| makemv data delim=";"
| mvexpand data
| makemv data delim=","
| eval to=mvindex(data,0), from=mvindex(data,1), type=mvindex(data,2)
| makemv data
| table from to type linktext
| eval count=substr(tostring(random()),1,2)
| eval color=case(count>=0 AND count<30, "#DC4E41",
                  count>=30 AND count<60, "#F1813F",
                  count>=60 AND count<75, "#F8BE34",
                  true(),"#B6C75A")
| eval value=from." (Service Health: ".count."%)"
すべて、makeresultsを使ってデータを作成している。Splunk謹製のダッシュボードは_(フィールド名)を使って、表示させないことを結構つかっているな〜という印象。
$tokHosts$ $ICON_COMPUTER$はダッシュボードの最初の方でinitで定義されている。
color
network diagram vizであればcolor region chart vizであればregionで色を指定するので、このように指定している。
region_chart_viz.spl
| eval regions = "Normal=#98C697,".Perc68.",Warning=#FBD886,".Perc75.",Severe=#F7B48C,".Perc95.",Critical=#EA958D"
network_diagram.spl
| eval color=case(count>=0 AND count<30, "#DC4E41",
count>=30 AND count<60, "#F1813F",
count>=60 AND count<75, "#F8BE34",
true(),"#B6C75A")
JS
tooltip用javascript。長いので折り畳み
// Copyright 2020 Splunk Inc.
require([
    'underscore',
    'splunkjs/mvc',
    'splunkjs/mvc/tableview',
    'splunkjs/mvc/simplexml/ready!'
], function (_, mvc, TableView) {

    var refreshCounter = 0;
    var strRefresh = "1";
    var defaultTokenModel = mvc.Components.get("submitted");
    var CustomTooltipRenderer = TableView.BaseCellRenderer.extend({
        canRender: function (cell) {
            // Apply cell rendering extension for "server" column
            return cell.field === 'server';
        },
        render: function ($td, cell) {
            // Cell value for extension must have 4 multivalued results
            if (cell !== undefined && cell.value.length == 4) {
                // 0 - KPI Status
                // 1 - Icon
                // 2 - Host
                // 3 - KPI Percent
                var strStatus = cell.value[0];
                var strIcon = "fa fa-" + cell.value[1];
                var strServerName = cell.value[2];
                var strKPIPerc = cell.value[3];
                var strTileSize = "xsmall";
                if (defaultTokenModel.get("tokTileSize") !== undefined) {
                    strTileSize = defaultTokenModel.get("tokTileSize");
                };
                // Apply class based on KPI Status (for CSS Override)
                switch (strStatus) {
                    case "critical":
                        STATUS_CLASS = "critical";
                        break;
                    case "severe":
                        STATUS_CLASS = "severe";
                        break;
                    case "medium":
                        STATUS_CLASS = "medium";
                        break;
                    case "normal":
                        STATUS_CLASS = "normal";
                        break;
                    default:
                        STATUS_CLASS = "unknown";
                }
                // If xsmall option is chosen show only rectangular box with Tooltip
                // Else render multivalue table cell.
                if (strTileSize === "xsmall") {
                    $td.html(_.template('<span data-toggle="tooltip" data-placement="right" data-original-title="<%- server%> (<%- cpu%>)"> </span>', {
                        server: strServerName,
                        cpu: strKPIPerc
                    }));
                    // This line wires up the Bootstrap tooltip to the cell markup
                    $td.children('[data-toggle="tooltip"]').tooltip();
                    $td.addClass("custom-tooltip-cell").addClass(STATUS_CLASS);
                } else {
                    $td.html(_.template('<div tabindex="0" class="multivalue-subcell" data-mv-index="0"><%- status%></div>' +
                        '<div tabindex="1" class="multivalue-subcell" data-mv-index="1"><i class="<%- icon%>"></i></div>' +
                        '<div tabindex="2" class="multivalue-subcell" data-mv-index="2"><%- kpi%></div>' +
                        '<div tabindex="3" class="multivalue-subcell" data-mv-index="3"><%- server%></div>', {
                        status: strStatus,
                        icon: strIcon,
                        kpi: strKPIPerc,
                        server: strServerName
                    }));
                }
            }
        }
    });
    // When Tile Size option changes reset token to refresh table.
    defaultTokenModel.on("change:tokTileSize", function (newtokTileSize, tokTileSize, options) {
        if (tokTileSize !== undefined || tokTileSize !== "$value$") {
            strtokTileSize = tokTileSize;
            defaultTokenModel.unset("tokRefresh");
            // Keep looping Refresh counter and update on each Tile Size option change.
            // Add tokRefresh dummy dependency to the Search to ensure
            // table refreshes each time Tile Size option changes.
            if (refreshCounter == 2) {
                refreshCounter = refreshCounter + 1;
                strRefresh = refreshCounter.toString();
            } else {
                refreshCounter = 1;
                strRefresh = refreshCounter.toString();
            }
            defaultTokenModel.set("tokRefresh", "refresh" + strRefresh);
            // Register custom cell renderer, the table will re-render automatically
            mvc.Components.get('table_tile').getVisualization(function (tableView) {
                var customRenderer = tableView.getCellRenderers();
                tableView.removeCellRenderer(customRenderer);
                // Register custom cell renderer
                tableView.table.addCellRenderer(new CustomTooltipRenderer());

                // Force the table to re-render
                tableView.table.render();
            });
        }
    });
    // First time table render for table with id="table_tile"
    mvc.Components.get('table_tile').getVisualization(function (tableView) {
        // Register custom cell renderer
        tableView.table.addCellRenderer(new CustomTooltipRenderer());

        // Force the table to re-render
        tableView.table.render();
    });
});
解説
何やっているのかちょっとわからなかったので、
<form hideSplunkBar="true" hideTitle="true" theme="dark" >
  <!-- script="/scripts/table_with_tooltip.js" -->
といったんコメントアウトして、splunkを下記の方法で再起動してみる。
http://your_splunk:your_port/ja-JP/debug/refresh?entity=admin/views

Font Awesomeが表示されなくなり、マウスを上にやってもtooltipが表示されなくなった。
tooltip用なのねということで、細かいところは下記の通り。
JQueryについては、たぶんここ
![]() JQueryとSplunkJSをまとめて説明できる技能はありません。
JQueryとSplunkJSをまとめて説明できる技能はありません。
CSS
panel_fieldset
            /* START - Bring Radio Options to Same Line */
            #panel_fieldset #link_size.input-link{
              width: 380px;
            }
            #panel_fieldset #radio_sort_field div[data-component="splunk-core:/splunkjs/mvc/components/RadioGroup"]{
            	display: -webkit-box;
            }
            #panel_fieldset #radio_sort_field.input-radio{
              width: 240px !important;
            }
            /* END - Bring Radio Options to Same Line */
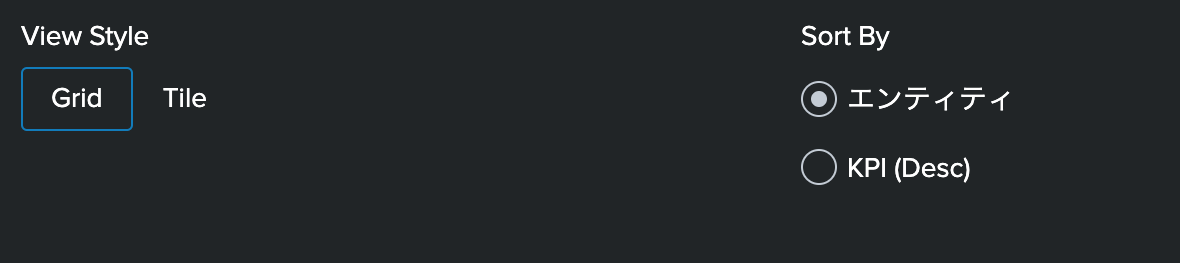
画像のとおり、2つのインプットを並べているのがこちら
綺麗に並べるためにはdisplay: -webkit-box;が必要
コメントアウトしてリロードすると、2つのinputの大きさが違ってしまっているのが確認できる。
input_link_tab1
            /* START - Tab View CSS Style */
            #panel_layout .fieldset{
            	padding: 10px 12px 0px 12px !important;
            }
            #input_link_tab1.input-link{
            	width: 440px !important;
            }
            #input_link_tab1 label{
              display:none !important;
            }
            #input_link_tab1.input-link div[data-component="splunk-core:/splunkjs/mvc/components/LinkList"]{
            	display: -webkit-box !important;
            }
            #input_link_tab1.input-link button{
              width: 120px !important;
              border-top-color: #E1E6EB;
              border-top-style: solid;
              border-top-width: 1px;
              border-right-color: #E1E6EB;
              border-right-style: solid;
              border-right-width: 1px;
              border-left-color: #E1E6EB;
              border-left-style: solid;
              border-left-width: 1px;
            	border-top-left-radius: 10px;
              border-top-right-radius: 10px;
            }
            .dashboard-panel #input_link_split_by label,
            #input_link_tab1 .splunk-choice-input-message{
              display: none !important;
            }
            #html_tab_hr hr{
              height:1px;
              border-width:0;
              color: black;
              background-color: #E1E6EB;
              margin: 0px;
            }
            #html_tab_hr .panel-body.html{
            	padding: 0px !important;
            }
            /* END - Tab View CSS Style */

画像のとおり、上のタブ切替に見えるようにしているCSSがこちら
が元ネタ
table_tile
            /* START - Table as Tile CSS Style Override */
            #table_tile div#statistics.results-table {
              overflow-y: auto !important;
              height: 420px !important;
              padding-left: 5px !important;
            }
            #table_tile table tbody{
              display:flex;
              flex-wrap: wrap;
            }
            #table_tile table th{
               display: none !important;
            }
            #table_tile table tbody tr{
              margin-right:10px;
              margin-bottom:10px;
            }
            #table_tile table tbody tr td{
              width: $tokTileWidth$;
              text-align: center;
              display: grid;
              color: #fff !important;
              font-weight: bold;
            }
            #table_tile table tbody tr td div[data-mv-index="0"].multivalue-subcell{
               display:none;
            }
            #table_tile table tbody tr td div[data-mv-index="1"].multivalue-subcell{
               margin-top: $tokIconTopPadding$;
               font-size: $tokIconFontSize$;
            }
            #table_tile table tbody tr td div[data-mv-index="2"].multivalue-subcell{
               margin-top: $tokIconTopPadding$;
               font-size: $tokLabelFontSize$;
               display: $tokHideHost$;
            }
            #table_tile table tbody tr td div[data-mv-index="3"].multivalue-subcell{
               margin-top: $tokLabelTopPadding$;
               font-size: $tokLabelFontSize$;
               display: $tokHideKPI$;
            }
            /* END - Table as Tile CSS Style Override */
テーブルをタイル表示にする、CSS
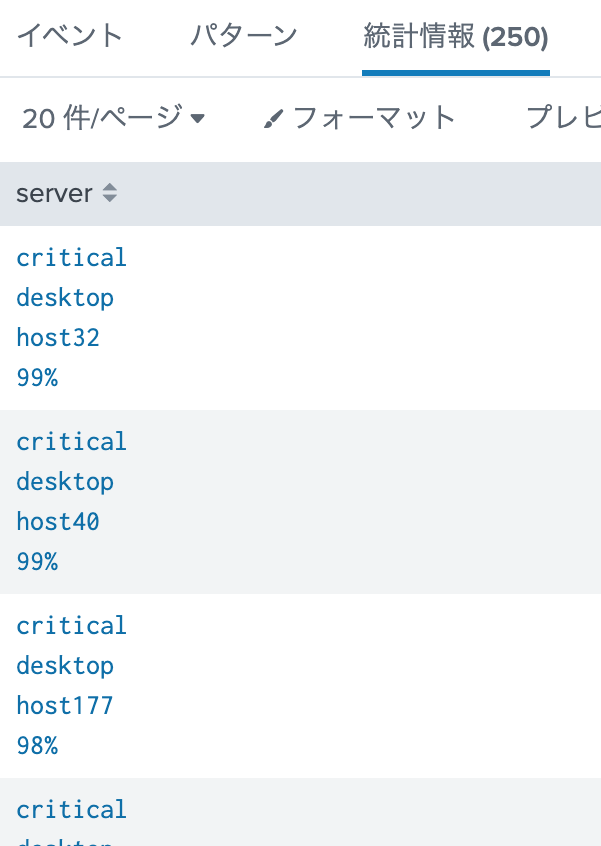
このテーブルがタイル表示になるという・・・
          <!-- Mimics heatmap view -->
          <condition value="xsmall">
            <set token="tokIconFontSize">0%</set>
            <set token="tokLabelFontSize">initial</set>
            <set token="tokTileWidth">8px</set>
            <set token="tokHideKPIName">none</set>
            <set token="tokHideHost">none</set>
            <set token="tokHideKPI">none</set>
          </condition>
          <!-- Mimics Tile view -->
          <condition value="small">
            <set token="tokIconFontSize">100%</set>
            <set token="tokLabelFontSize">100%</set>
            <set token="tokTileWidth">80px</set>
            <set token="tokHideKPIName">initial</set>
            <set token="tokHideHost">initial</set>
            <set token="tokHideKPI">initial</set>
          </condition>
Gridと`Tile`の切替でCSSのパラメータを上記の通り変更している。
            #table_tile table tbody{
              display:flex;
              flex-wrap: wrap;
            }
で表の列を横に並ぶようにして、大きさやフォントの大きさを変えることによって多数のステータスを表示している。
元ネタ。自分にとっても思い出深いです。
まとめ
Splunk Dashboards app (beta)が出てきて、実際はCSSとかいじらなくても、いろいろとできるようになっています。
でも、細かい設定をいじるとなるとまだSimpleXMLのほうがやりやすいかな〜と思います。
このAPPSはいろいろなSimpleXMLのテクニックが詰まっているので、是非ダウンロードしていろいろと見てもらいたいと思います。
このItsy Bitsy App for Splunkは@niketnilayがSplunk Answersで色々と回答してきたことをまとめたようなAppsで、自分も.conf20で発表があるということでとても楽しみでした。
直前に悲報があってNiket NilayのすばらしいdashboardやテクニックはSplunk Answersやwikiに残るものが全てとなってしまいました。
初心者を卒業した後Splunkで勉強することを質問した時とかいろいろと教えてもらいました。心の師匠です。少しずつでも、CSSやJSを勉強していきたいと思います。
R.I.P. Niket Nilay