正規分布
wikipedia
![]() これがわかるなら、勉強は必要ないと思う。
これがわかるなら、勉強は必要ないと思う。
標準正規分布
f(x) = \frac{1}{\sqrt{2\pi \sigma^2}} \exp \left(-\frac{(x - \mu)^2}
{2\sigma^2} \right) \hspace{20px} (-\infty < x < \infty)
のうち標準正規分布は平均0、標準偏差1のものなので
f(x) = \frac{1}{\sqrt{2\pi}} \exp \left(-\frac{x^2}
{2} \right) \hspace{20px} (-\infty < x < \infty)
ベルカーブ
standardNormalDistribution.r
x<-seq(-4,4,0.1)
curve(dnorm(x,0,1),from=-4,to=4,type="l")
なので、これをSplunkでやってみる。
SPL
| makeresults count=81
| streamstats current=f count as x
| eval x = x * .10 - 4.0
| eval y= 1 / exact(sqrt(2*pi())) * exact(exp(pow(x,2) * -0.5))
| table x y
解説
-
| makeresults count=81- -4〜0〜4を0.1区切りで作成する必要があるため81個の行を作成
-
| streamstats current=f count as x- xとして0〜80までの数字を作成。current=fがないと1〜81となる。
-
| eval x = x * .10 - 4.0- -4.0から0.1区切りで作成するため、0.10をかけ、−4.0を引いた。
0を追加しているのは表示桁数を揃えるため。ここらへんがプログラムっぽい。
- -4.0から0.1区切りで作成するため、0.10をかけ、−4.0を引いた。
-
| eval y= 1 / exact(sqrt(2*pi())) * exact(exp(pow(x,2) * -0.5))- 公式通りに計算。exactがないと切ないグラフになる。
-
| table x y- xとyの表とする。
x作成方法
SPL
| makeresults
| eval x=split("-4.0,4.0",",")
| stats count by x
| makecontinuous span=0.1 x
なんかできるかなと思ったらできた。総数がわからないときはこっちでいいと思う。
68%-95%-99.7%の法則
SPL
| makeresults
| eval x=split("-4.00,4.00",",")
| stats count by x
| makecontinuous span=0.01 x
| eval y= 1 / exact(sqrt(2*pi())) * exact(exp(exact(pow(x,2)) * -0.5))
| table x y
| eval z=if(abs(x) <= 1,y,NULL)
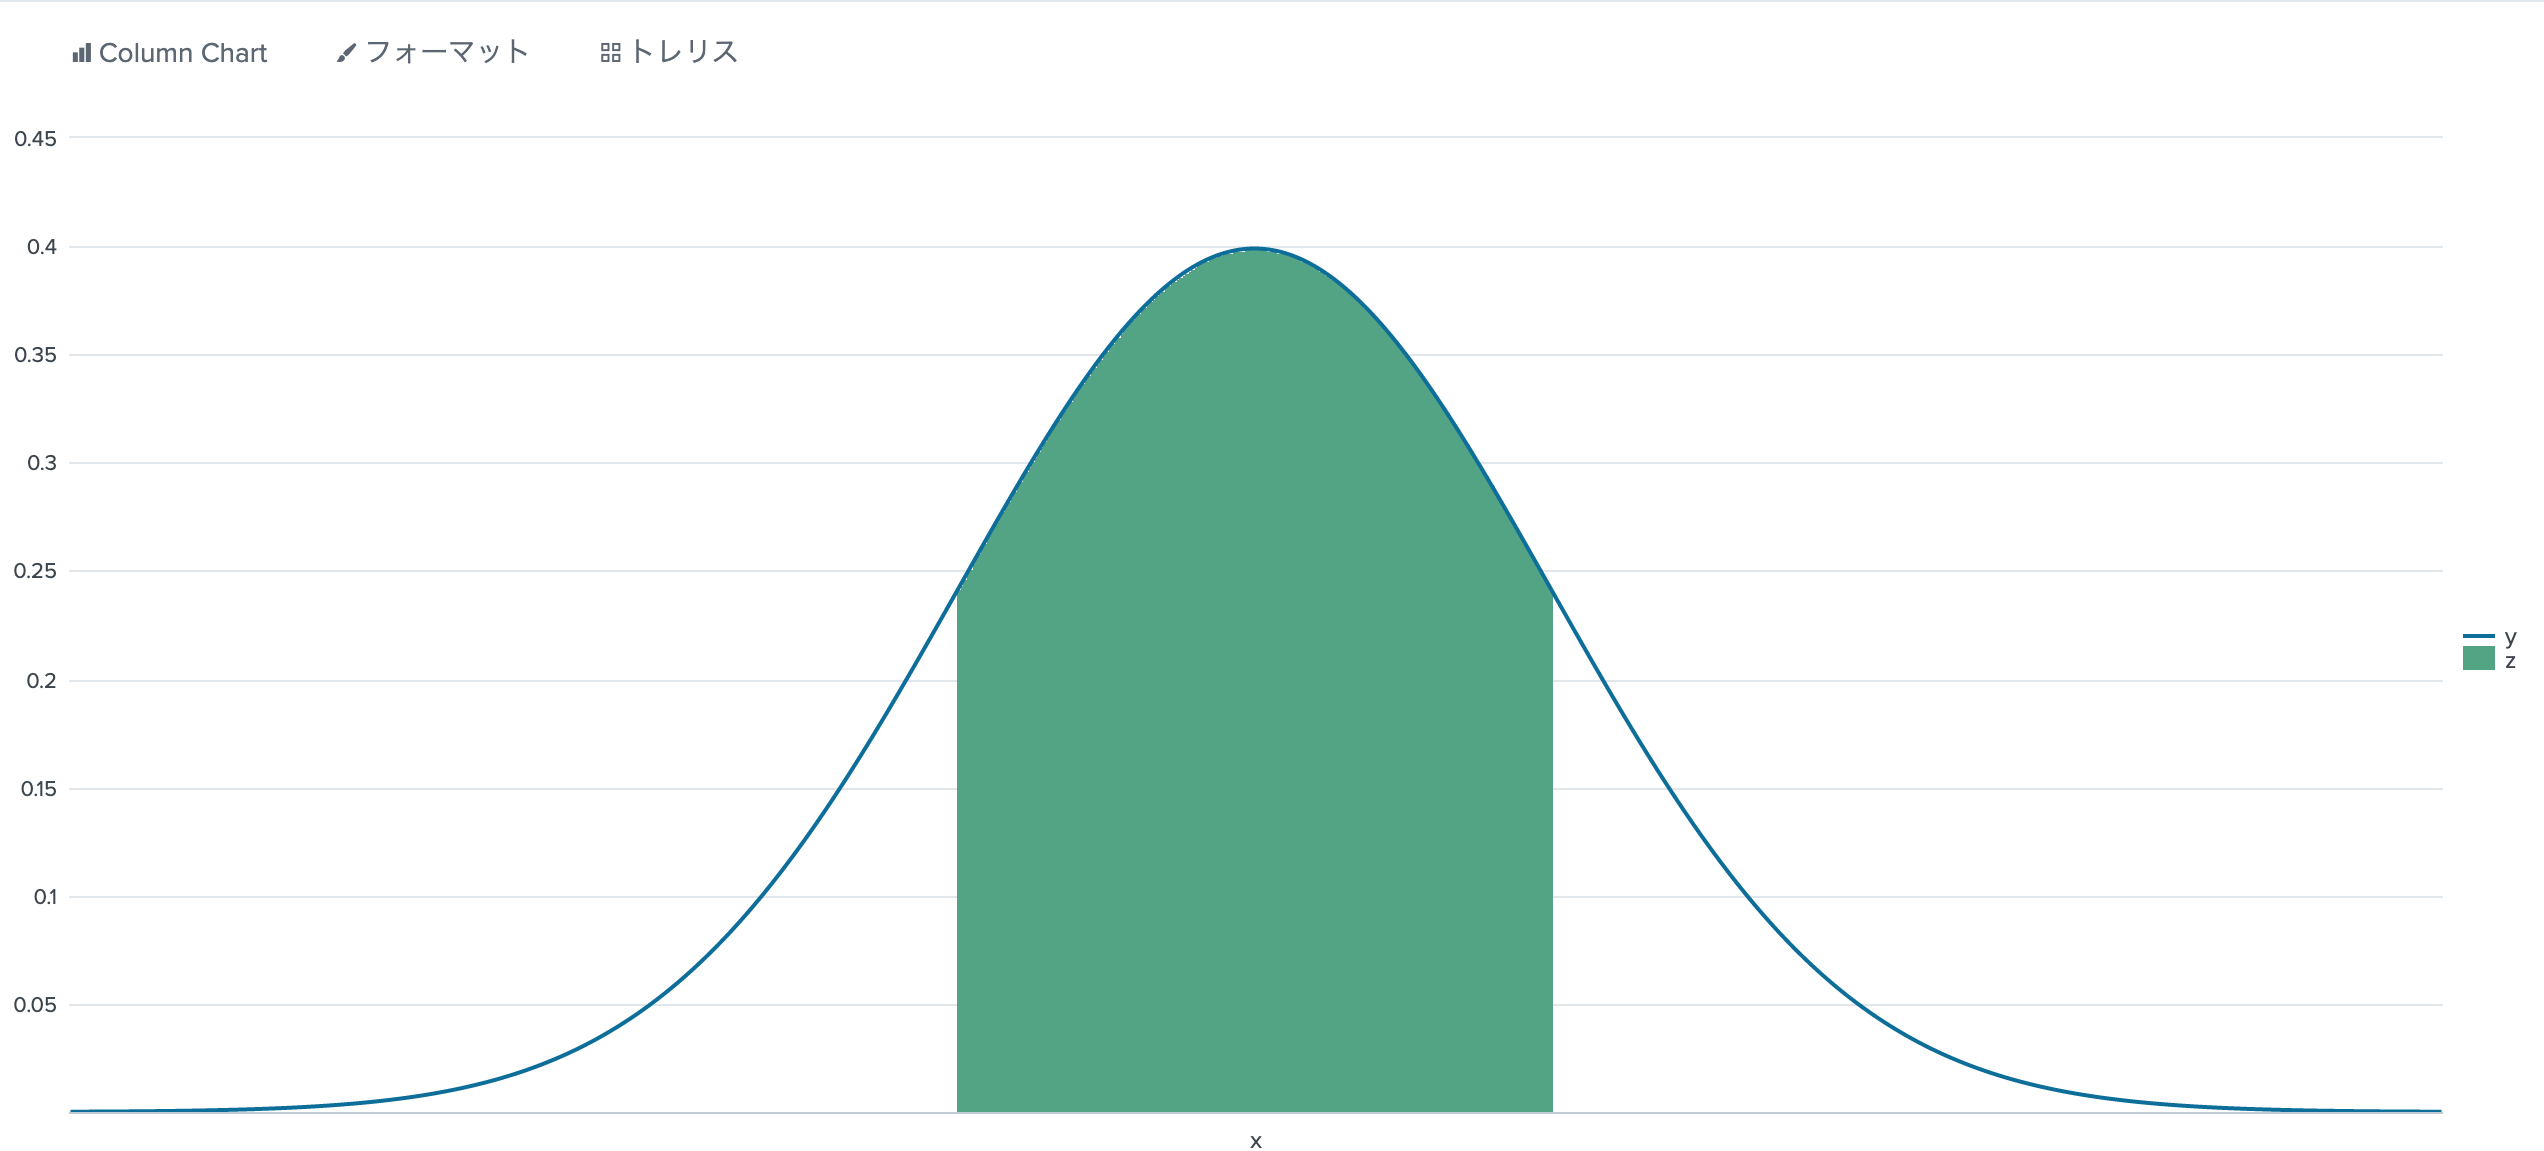
確率変数Zとしたときの確率P(-1<=Z<=1)の図
このようにZの値を変えて、法則通りの値がでるか試してみる。
SPL
| makeresults
| eval x=split("-4.00,4.00",",")
| stats count by x
| makecontinuous span=0.01 x
| eval y= 1 / exact(sqrt(2*pi())) * exact(exp(exact(pow(x,2)) * -0.5))
| table x y
| eval z1=if(abs(x) <= 1,y,NULL), z2=if(abs(x) <= 2,y,NULL),z3=if(abs(x) <= 3,y,NULL)
| stats sum(*) as *
| foreach y z*
    [eval P<<MATCHSTR>>=z<<MATCHSTR>> / y * 100]
| table P*
| P1 | P2 | P3 |
|---|---|---|
| 68.51467376653717 | 95.5095796320241 | 99.74048181694857 |
それなりの値がでた。
やってみると下4桁(0.0001)で行数が多すぎですよのエラーがでた。
まとめ
グラフ書いたら満足したので、一旦締め。
この項はいろいろ勉強しないといけないので、更新していきます。