の4つめ
Loops and List Comprehensions
の最後の問題。
kaggleのdiscordで質問があったので作ってみた。
通常
MonteCarlo.py
import random

def play_slot_machine():
    r = random.random()
    if r < .005:
        return 100
    elif r < .05:
        return 5
    elif r < .25:
        return 1.5
    else:
        return 0

def estimate_average_slot_payout(n_runs):
    """Run the slot machine n_runs times and return the average net profit per run.
    Example calls (note that return value is nondeterministic!):
    >>> estimate_average_slot_payout(1)
    -1
    >>> estimate_average_slot_payout(1)
    0.5
    """
    r = [play_slot_machine() for _ in range(n_runs)]
    return (sum(r) - n_runs) / n_runs

# print(estimate_average_slot_payout(1000000))
# 0.021952

import matplotlib.pyplot as plt
import numpy as np

scale = np.linspace(100,1e6,100)
values = [estimate_average_slot_payout(int(i)) for i in scale]

coef = np.polyfit(scale,values,1)
poly1d_fn = np.poly1d(coef)

fig = plt.figure(figsize=(10,10))
ax = fig.add_subplot(1, 1, 1)

ax.plot(scale,values, '-b', scale, poly1d_fn(scale), '--k')
ax.axhline(y=.025,xmin=.05,c='red')

ax.ticklabel_format(style='plain',axis='x')
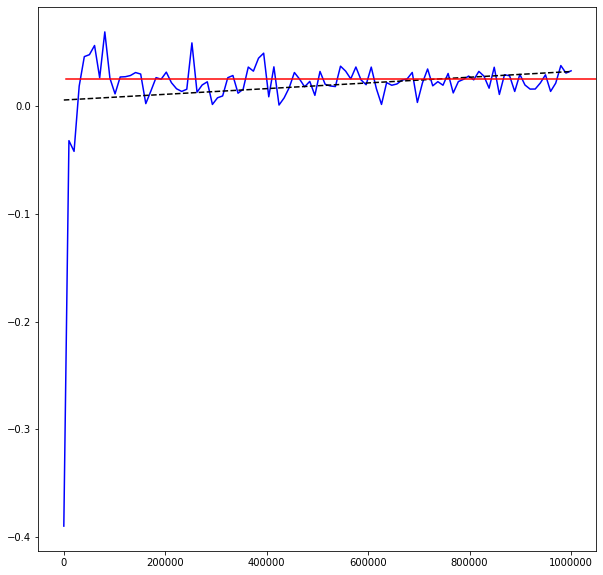
期待値である0.025に収縮していくのがわかる。
高速バージョン
faster_plotting.py
import random

# Analytic solution for expected payout =
# .005 * 100 + (.05 - .005) * 5 + (.25 - .05) * 1.5

def play_slot_machine():
    r = random.random()
    if r < .005:
        return 100
    elif r < .05:
        return 5
    elif r < .25:
        return 1.5
    else:
        return 0


import numpy as np
import matplotlib.pyplot as plt

def play_slot_machine(playingcount:int) -> np.ndarray:
    return np.random.choice([100,5,1.5,0],playingcount,p=[.005, .045, .2 , 0.75]) - np.ones(playingcount)

def expected_values(num:int) -> float:
    return play_slot_machine(num).sum() / num

def ploting(num):
    x = np.linspace(100,num,100,dtype=int)
    y = [expected_values(i) for i in x]


    fig = plt.figure(figsize=(10,10))
    ax = fig.add_subplot(1, 1, 1)

    ax.plot(x,y)
    ax.set_title('Expected Value 0.025')
    ax.ticklabel_format(style='plain',axis='x')
    ax.axhline(y=.025,xmin=.05,c='red')

    return

ploting(1000000)
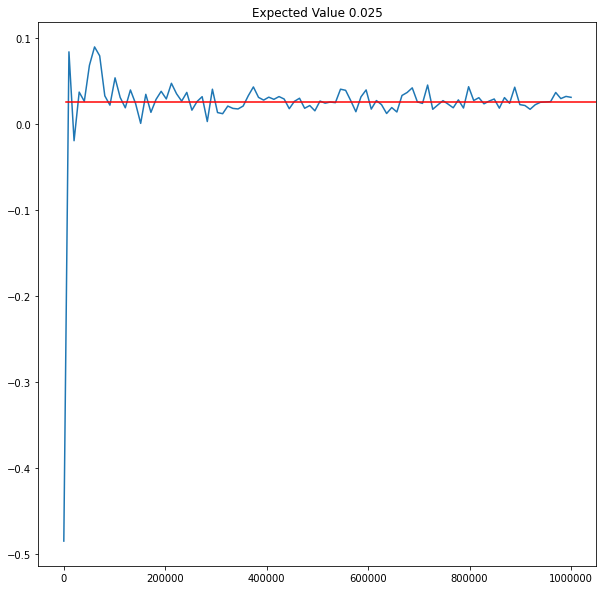
np.random.choiceで確率に応じて値が抽出できるなと思って作ってみた。(ずっと確率計算でミスをしていて収縮する値が違っていました![]() )
)
yのところはもう少し速くできそう。
みやすく
goodlooking.py
import numpy as np
import matplotlib.pyplot as plt

def play_slot_machine(playingcount:int) -> np.ndarray:
    return np.random.choice([100,5,1.5,0],playingcount,p=[.005, .045, .2 , 0.75]) - np.ones(playingcount)

def expected_values(num:int) -> float:
    return play_slot_machine(num).sum() / num

def ploting(num):
    x = np.linspace(10000,num,100,dtype=int)
    y = [expected_values(i) for i in x]

    fig = plt.figure(figsize=(10,10))
    ax = fig.add_subplot(1, 1, 1)

    ax.plot(x,y)
    ax.set_title('Expected Value 0.025')
    ax.ticklabel_format(style='plain',axis='x')
    ax.plot(x,[.025]*100,'r--')


    return

ploting(4e7)

最初のばらつきが大きいところをカットしたもの。かなりわかりやすくなった。
期待値のラインもplt.plotに変えている。
せっかく作ったので記念書き込み。