やあ、みんな ![]() だよ
だよ
![]() いつもの作者は「
いつもの作者は「![]() の記事もわかりづらいですね」と言われて凹んだので、僕が呼ばれたよ。よろしくね。
の記事もわかりづらいですね」と言われて凹んだので、僕が呼ばれたよ。よろしくね。
![]() 今回は一週間前とかの値と比較するときのやり方を説明するよ
今回は一週間前とかの値と比較するときのやり方を説明するよ
Macosxで動かしているので、WindowsやLinuxの人はディレクトリやフォルダを読み替えてね。
今回使うもの

![]() 時間:
時間:過去24時間やモード:スマートモードは変更しないでね
使うコマンド
![]() 結構多いね。でも全部普段も使うコマンドだから、リンク先もしっかり読んだほうがいいよ。英語だけど。
結構多いね。でも全部普段も使うコマンドだから、リンク先もしっかり読んだほうがいいよ。英語だけど。
とりあえず一週間分を出してみる
| tstats count where index=_internal earliest=-8d@d latest=-1d@d by _time span=1h
| timewrap 1d
| streamstats count as session
| streamstats count(eval(session % 2 = 1)) as session2
| stats min(_time) as _time sum(*) as * by session2
| fields - session*
| table _time 6* 5* 4* 3* 2* 1* latest_day
| sort _time
| _time | 6days_before | 5days_before | 4days_before | 3days_before | 2days_before | 1day_before | latest_day |
|---|---|---|---|---|---|---|---|
| 2020/05/18 00:00 | 24835 | 34731 | 294 | 34851 | 34693 | 34474 | 350 |
| 2020/05/18 02:00 | 36702 | 35197 | 35355 | 39202 | 35160 | 34951 | 17494 |
| 2020/05/18 04:00 | 41798 | 29630 | 41165 | 27755 | 34836 | 34485 | 336 |
| 2020/05/18 06:00 | 39622 | 29622 | 42681 | 30981 | 39027 | 37090 | 24444 |
| 2020/05/18 08:00 | 40163 | 21598 | 32780 | 34716 | 50662 | 28831 | 39272 |
| 2020/05/18 10:00 | 46149 | 33517 | 34023 | 34699 | 38170 | 38578 | |
| 2020/05/18 12:00 | 41633 | 34832 | 37144 | 34848 | 41238 | 33172 | |
| 2020/05/18 14:00 | 35926 | 34703 | 41420 | 34686 | 34237 | 26102 | |
| 2020/05/18 16:00 | 30854 | 34731 | 41623 | 36550 | 28231 | 15156 | 35860 |
| 2020/05/18 18:00 | 25877 | 34696 | 26637 | 25344 | 28788 | 28297 | 42410 |
| 2020/05/18 20:00 | 39863 | 39176 | 27674 | 17343 | 35039 | 30082 | 34772 |
| 2020/05/18 22:00 | 25817 | 27113 | 34684 | 34706 | 23053 | 1535 | 26495 |
|
|
![]()
span=2hでやってもらうとわかるけど、時間が変な感じになるんだよね
binを使ってみた。
| tstats count where index=_internal earliest=-8d@d latest=-1d@d by _time span=1h
| bin _time span=2h aligntime=@d
| stats sum(count) as count by _time
| sort _time
| timewrap 1d
timechartを使ってみた
| tstats count where index=_internal earliest=-8d@d latest=-1d@d by _time span=1h
| timechart sum(count) as count span=2h aligntime=@d
| timewrap 1d
![]() なんとか結果が一緒になったよ。
なんとか結果が一緒になったよ。
![]() 偶数の時間で集計するときはいったん奇数の時間で集計してから、取りまとめないといけないみたいだね。
偶数の時間で集計するときはいったん奇数の時間で集計してから、取りまとめないといけないみたいだね。
フィールドの値毎に集計してみる
| tstats count where index=_internal earliest=-8d@d latest=-1d@d sourcetype=splunkd OR sourcetype=splunkd_access by _time span=1h sourcetype
| timechart sum(count) as count span=2h aligntime=@d by sourcetype
| timewrap 1d
| _time | splunkd_6days_before | splunkd_access_6days_before | splunkd_5days_before | splunkd_access_5days_before | splunkd_4days_before | splunkd_access_4days_before | splunkd_3days_before | splunkd_access_3days_before | splunkd_2days_before | splunkd_access_2days_before | splunkd_1day_before | splunkd_access_1day_before | splunkd_latest_day | splunkd_access_latest_day |
|---|---|---|---|---|---|---|---|---|---|---|---|---|---|---|
| 2020/05/18 00:00 | 24588 | 44 | 34683 | 44 | 294 | 34803 | 44 | 34645 | 44 | 34426 | 44 | 329 | 19 | |
| 2020/05/18 02:00 | 35154 | 471 | 34765 | 422 | 33842 | 476 | 36561 | 492 | 34737 | 413 | 34523 | 415 | 17401 | 83 |
| 2020/05/18 04:00 | 37928 | 113 | 29583 | 43 | 36858 | 234 | 27375 | 44 | 34788 | 44 | 34437 | 44 | 330 | 5 |
| 2020/05/18 06:00 | 37375 | 127 | 29575 | 43 | 38487 | 232 | 30933 | 44 | 36001 | 282 | 35539 | 138 | 22778 | 173 |
| 2020/05/18 08:00 | 36403 | 69 | 21548 | 46 | 30183 | 89 | 34668 | 44 | 39040 | 1618 | 25122 | 247 | 36768 | 176 |
| 2020/05/18 10:00 | 37004 | 119 | 33468 | 44 | 33302 | 42 | 34651 | 44 | 36376 | 121 | 36743 | 55 | ||
| 2020/05/18 12:00 | 36892 | 306 | 34785 | 43 | 36617 | 43 | 34802 | 42 | 36513 | 93 | 30537 | 78 | ||
| 2020/05/18 14:00 | 35015 | 79 | 34655 | 44 | 36028 | 45 | 34641 | 41 | 32805 | 49 | 24424 | 62 | ||
| 2020/05/18 16:00 | 30350 | 104 | 34684 | 43 | 36258 | 65 | 35050 | 132 | 27303 | 63 | 13241 | 115 | 33945 | 96 |
| 2020/05/18 18:00 | 25130 | 44 | 34647 | 45 | 26013 | 44 | 24015 | 45 | 28089 | 44 | 27400 | 46 | 36469 | 56 |
| 2020/05/18 20:00 | 36626 | 173 | 36460 | 131 | 24005 | 59 | 17246 | 62 | 34843 | 60 | 28927 | 79 | 34679 | 59 |
| 2020/05/18 22:00 | 24717 | 57 | 27065 | 44 | 34633 | 44 | 34659 | 43 | 23005 | 44 | 1453 | 46 | 26445 | 46 |
![]() 横に長くなりすぎるので、フィールドの値を2つにしてみたけど、長すぎだよね。
横に長くなりすぎるので、フィールドの値を2つにしてみたけど、長すぎだよね。
![]() グラフでみるだけならいいけど、これから計算するにはこのままだと何もできないよね。
グラフでみるだけならいいけど、これから計算するにはこのままだと何もできないよね。
untableしてみる。
| tstats count where index=_internal earliest=-8d@d latest=-1d@d sourcetype=splunkd OR sourcetype=splunkd_access by _time span=1h sourcetype
| timechart sum(count) as count span=2h aligntime=@d by sourcetype
| timewrap 1d
| untable _time sourcetype count
| rex field=sourcetype "(?<source>.*?)_(?<timeargs>(\d|latest_)day.*)"
| eventstats sum(count) as weekly_total by _time source
| where timeargs="latest_day"
| stats max(count) as count max(weekly_total) as weekly_total by _time source
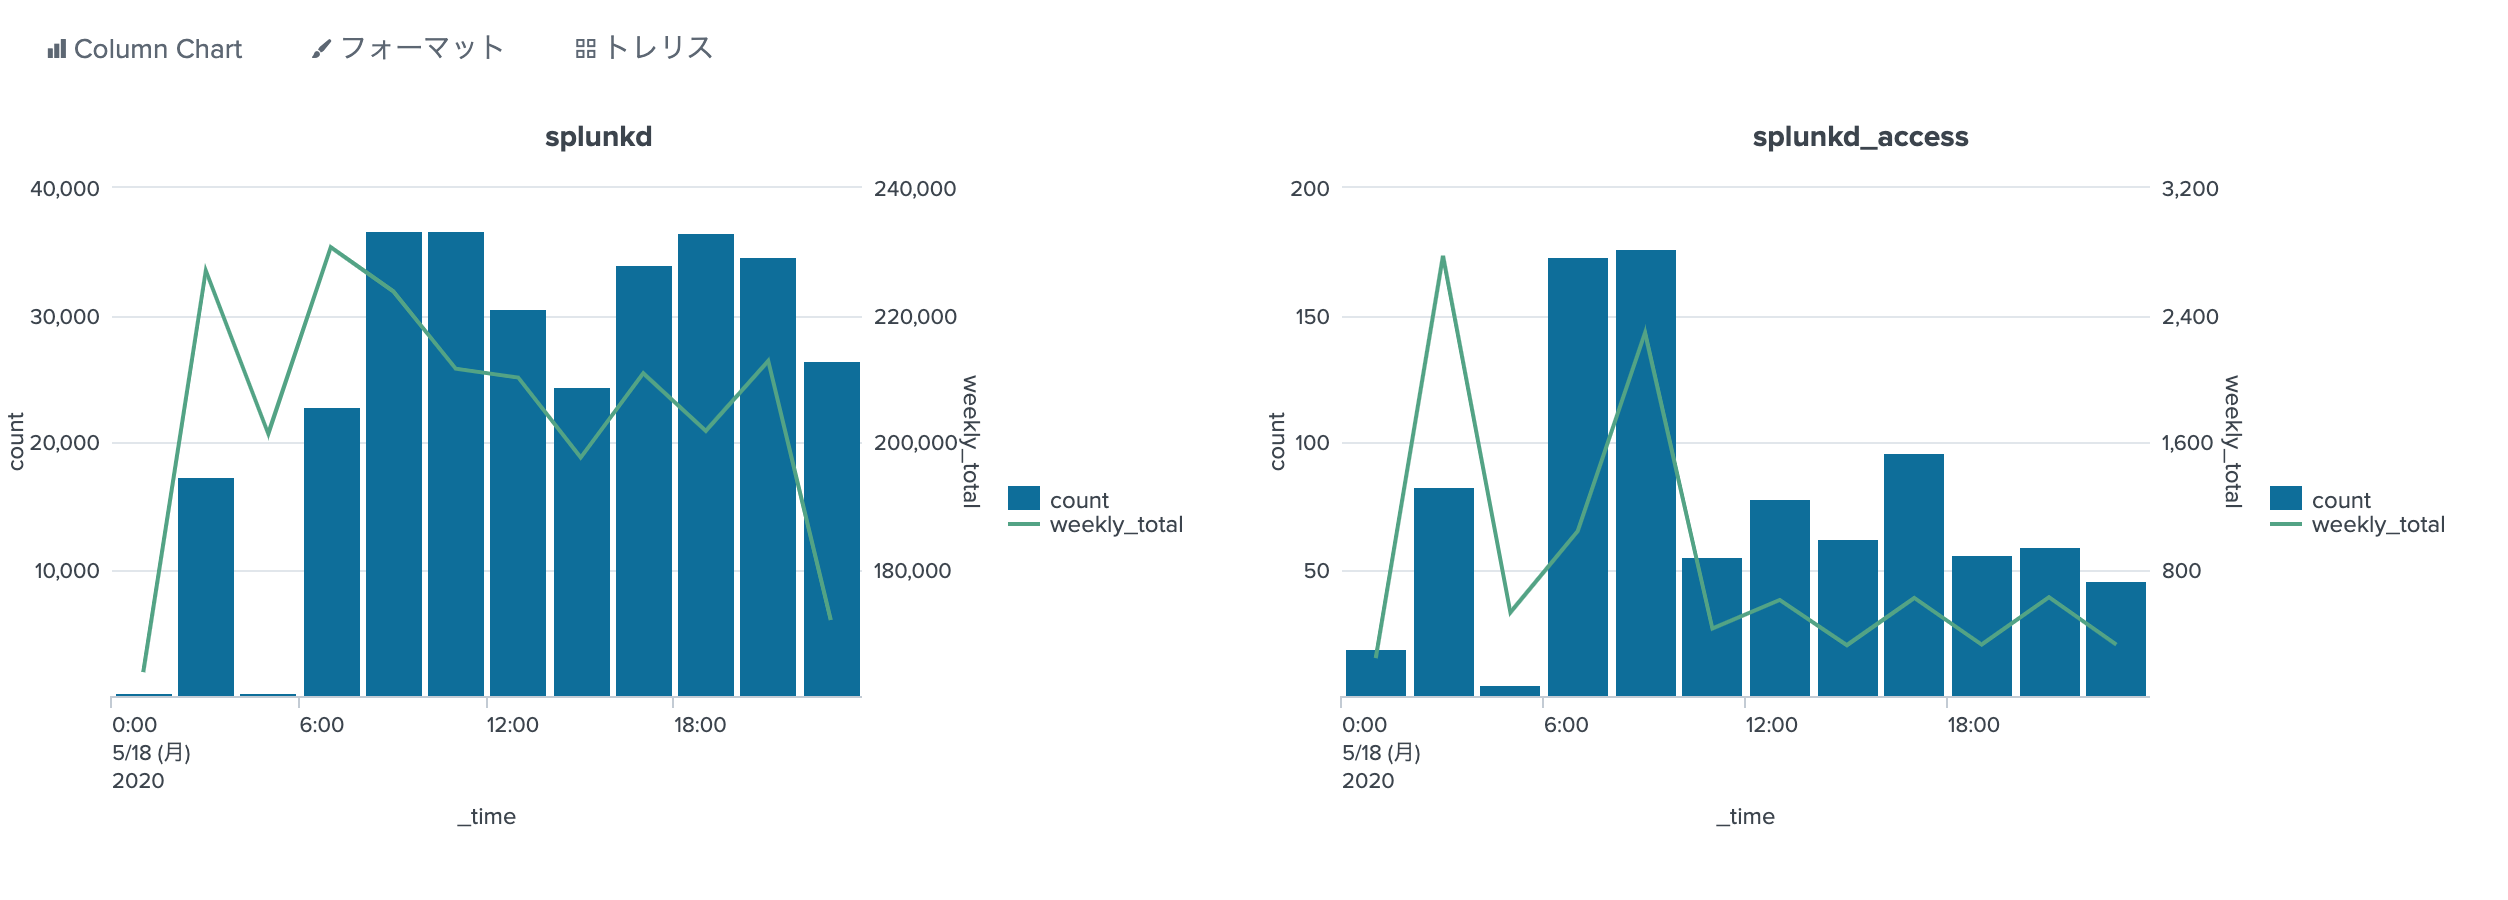
![]() このごろ中の人がトレリス表示が好きで、すぐこんなもの作るんだ。
このごろ中の人がトレリス表示が好きで、すぐこんなもの作るんだ。
解説
![]() コアラでもわかるSplunkシリーズ 時間毎集計するで話たとおり、集計するにはまず
コアラでもわかるSplunkシリーズ 時間毎集計するで話たとおり、集計するにはまずuntableするんだよ。
![]() あとはお好みでやっていくんだけど、今回は
あとはお好みでやっていくんだけど、今回はrexを使ってまずはソースタイプの名前と時間の説明のところをフィールドとして分離してみたんだ。
![]() 正規表現の説明はできないのでやらないよ。regex101.comあたりが有名だよね。
正規表現の説明はできないのでやらないよ。regex101.comあたりが有名だよね。
![]() そのあと
そのあとeventstatsを使って一週間全体で集計したんだ。
![]()
timechartやstatsの後、全部を集計するときはeventstatsが便利だよ
![]()
whereのところは、最近の日の分だけを残したんだ。
![]()
eventstatsの結果は全ての行にでているから、これでいいんだよ
![]() トレリス表示を使わないなら単純に
トレリス表示を使わないなら単純に tableを使えばいいんだけど、中の人が凝ってしまってstatsで無理やり同じ表示をしているんだよね。
![]()
| table _time source count weekly_totalで同じ表ができるよ。
まとめ
![]()
timechartを使って単位時間で集計したあと、timewrapをつかうと、あんまり考えなくても、過去との比較ができる表を作ってくれるよ
![]() でも、そのままだと、集計とかが難しいので
でも、そのままだと、集計とかが難しいのでuntableしてね
![]()
timechart→untable→eventstatsはコンボといってもいいんじゃないかな。
![]() じゃ、またね〜
じゃ、またね〜
![]() リクエストまってま〜す
リクエストまってま〜す
![]()
index=_internalの保存期間が1ヶ月なので、あまり長い期間の分でやれなかった。