PythonでARモデルの推定
自己回帰(Autoregressive: AR)モデルとは
時系列データの時間軸に対して、過去の時刻のデータを用いた回帰モデルです。
$$y_t=c+\phi_1y_{t-1}+\phi_2y_{t-2}+\cdots + \phi_py_{t-p}+\epsilon_t$$
ここで$y_t$は時刻tにおけるデータ、$c,\phi_n$はARパラメータ、$\epsilon_t$は誤差項で、$\sigma^2$に従うホワイトノイズと仮定します。
ここでは、stattsmodelsを使ってAR(2)過程のデータを生成し、ARパラメータを推定してみます。
$$y_t=c+\phi_1 y_{t-1}+\phi_2 y_{t-2}+\epsilon_t$$
ARデータ生成
ここではAR(2)過程のデータを生成します。
import statsmodels.api as sm
import numpy as np
import matplotlib.pyplot as plt

# AR(2)過程のデータ作成
phi1 = 1.5
phi2 = -0.68
c = 5
sigma = 0.5 #分散0.25
T = 500
mu = c / (1 - phi1 - phi2)

ar_data = np.zeros(T)
ar_data[0] = mu + np.random.normal(0, sigma)
ar_data[1] = mu + np.random.normal(0, sigma)
for t in range(2, T):
    ar_data[t] = c + phi1 * ar_data[t-1] + phi2 * ar_data[t-2] + np.random.normal(0, sigma)

fig = plt.figure(figsize=(12,6))
plt.plot(ar_data)
plt.show()


#モデルの生成
ar_model = sm.tsa.AR(ar_data[:400])

#次数の決定(AIC)
order = ar_model.select_order(maxlag=6, ic='aic')
print ("The selected order of AR is %d" % order) #実際は2にはならないこともある

#決定した次数のモデルで推定
ar_res = ar_model.fit(maxlag=2)#強引に次数2で推定
print(ar_res.params)
print(ar_res.sigma2)
#print(ar_res.summary())

#推定したモデルによる予測
ar_predict = ar_res.predict(end=500)
fig, ax = plt.subplots(figsize=(12,6))
plt.plot(ar_data, label="observed")
plt.plot(ar_predict, '--', label="predicted")
plt.legend()
plt.show()
ここで期待値$\mu$は、定常性を仮定すると時刻$t$に依存しない値となります。
$$
\begin{align}
E[y_t] & = c+\phi_1 E[y_{t-1}]+\phi_2 E[y_{t-2}] \
& = c + \phi_1 \mu+\phi_2 \mu
\end{align}
$$
また、AR(2)過程のモデルを生成するにあたり、サンプルコードでは以下の定常性を満たすような値を設定しています。定常性の確認については、ADF検定などがよく用いられますが、別の機会に整理したいと思います。
- $|\phi_1| < 1$ : (AR(1)の定常性条件)
- $\phi_2 + \phi_1 < 1, ; \phi_2 - \phi_1 < 1, ; -1 < \phi_2 < 1$ : (AR(2)の定常性条件)
# AR(2)過程のデータ作成
phi1 = 1.5
phi2 = -0.6

モデルの生成、推定
500点のうち、400点を学習データとしてARモデルを生成し、パラメータを推定してみました。
#モデルの生成
ar_model = sm.tsa.AR(ar_data[:400])

#次数の決定(AIC)
order = ar_model.select_order(maxlag=6, ic='aic')
print ("The selected order of AR is %d" % order) #実際は2にはならないこともある

#決定した次数のモデルで推定
ar_res = ar_model.fit(maxlag=2)#強引に次数2で推定
print(ar_res.params)
print(ar_res.sigma2)
ARモデルの次数をAIC(赤池情報量基準)で選択してます。この他にもBIC(ベイズ情報量基準)などもよく用いられるようです。
なお、乱数で生成されるデータが毎回異なるため、毎回選択される次数が異なります。ここではモデルの最大次数を強引に2にして、期待値と比較してみます。
実行すると以下の結果が得られます。AICで選択された次数は今回はたまたま2となりましたが毎回変わります。強引に次数2で推定しています。だいたい期待値とあってるようです。
The selected order of AR is 2
[ 4.44716188  1.50675178 -0.66771794]
0.25690045562764735
ARモデルによる予測
推定したモデルで、500点までの予測値を出してプロットしてみます。
#推定したモデルによる予測
ar_predict = ar_res.predict(end=500)
fig, ax = plt.subplots(figsize=(12,6))
plt.plot(ar_data, label="observed")
plt.plot(ar_predict, '--', label="predicted")
plt.legend()
plt.show()
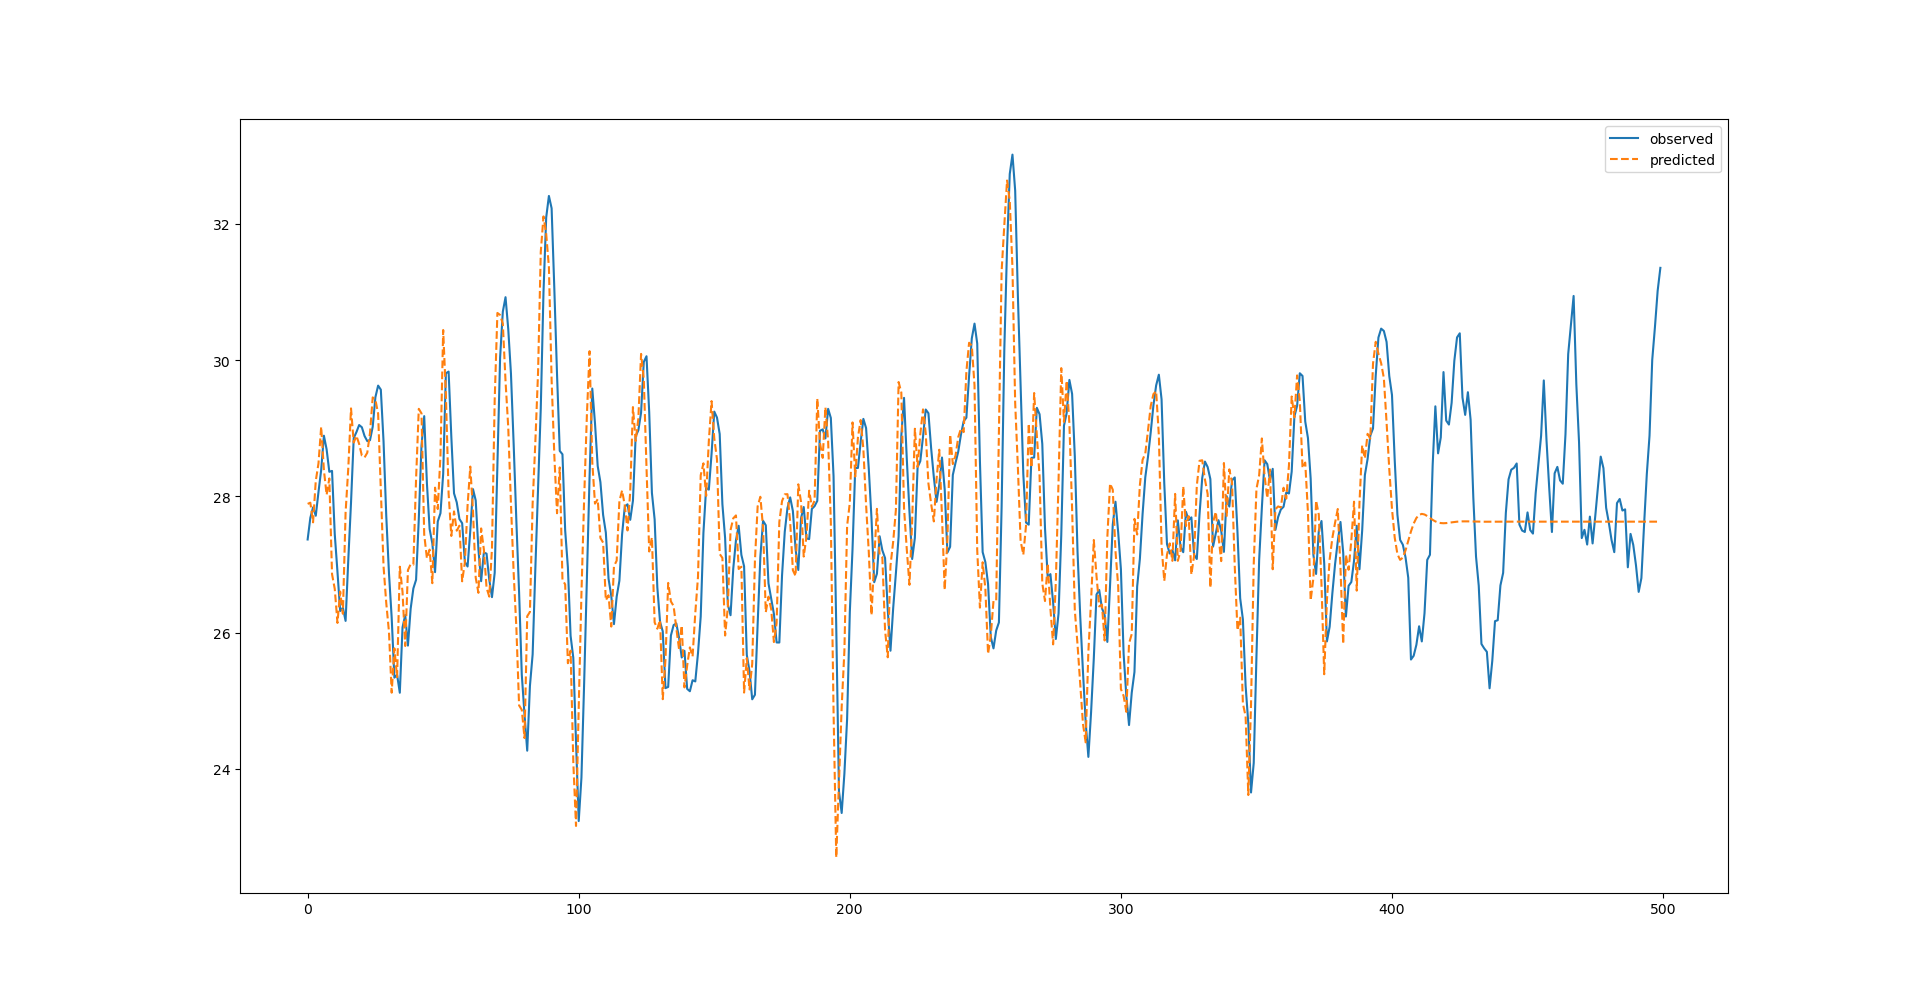
うーん。期待した結果と異なり、400点以降が全然予測できてません。ARパラメータはそこそこの精度で予測できてるのになぜ???
ちなみに実行すると以下のワーニングがでるのがちょっと気になってきました(statsmodelsのバージョンは0.12.2です)。もしかするとSARIMAXとか使うと予測できるかもしれません。別の機会で調べてみようと思います。
FutureWarning:
statsmodels.tsa.AR has been deprecated in favor of statsmodels.tsa.AutoReg and statsmodels.tsa.SARIMAX.