概要
e-Stat(政府統計の総合窓口)で公開されているAPIを利用し、取得した人口推移データを可視化するReactアプリです。
本稿では利用しているAPIやライブラリ等について簡単に紹介していきます。
成果物
ソースコードは こちら で公開しています。
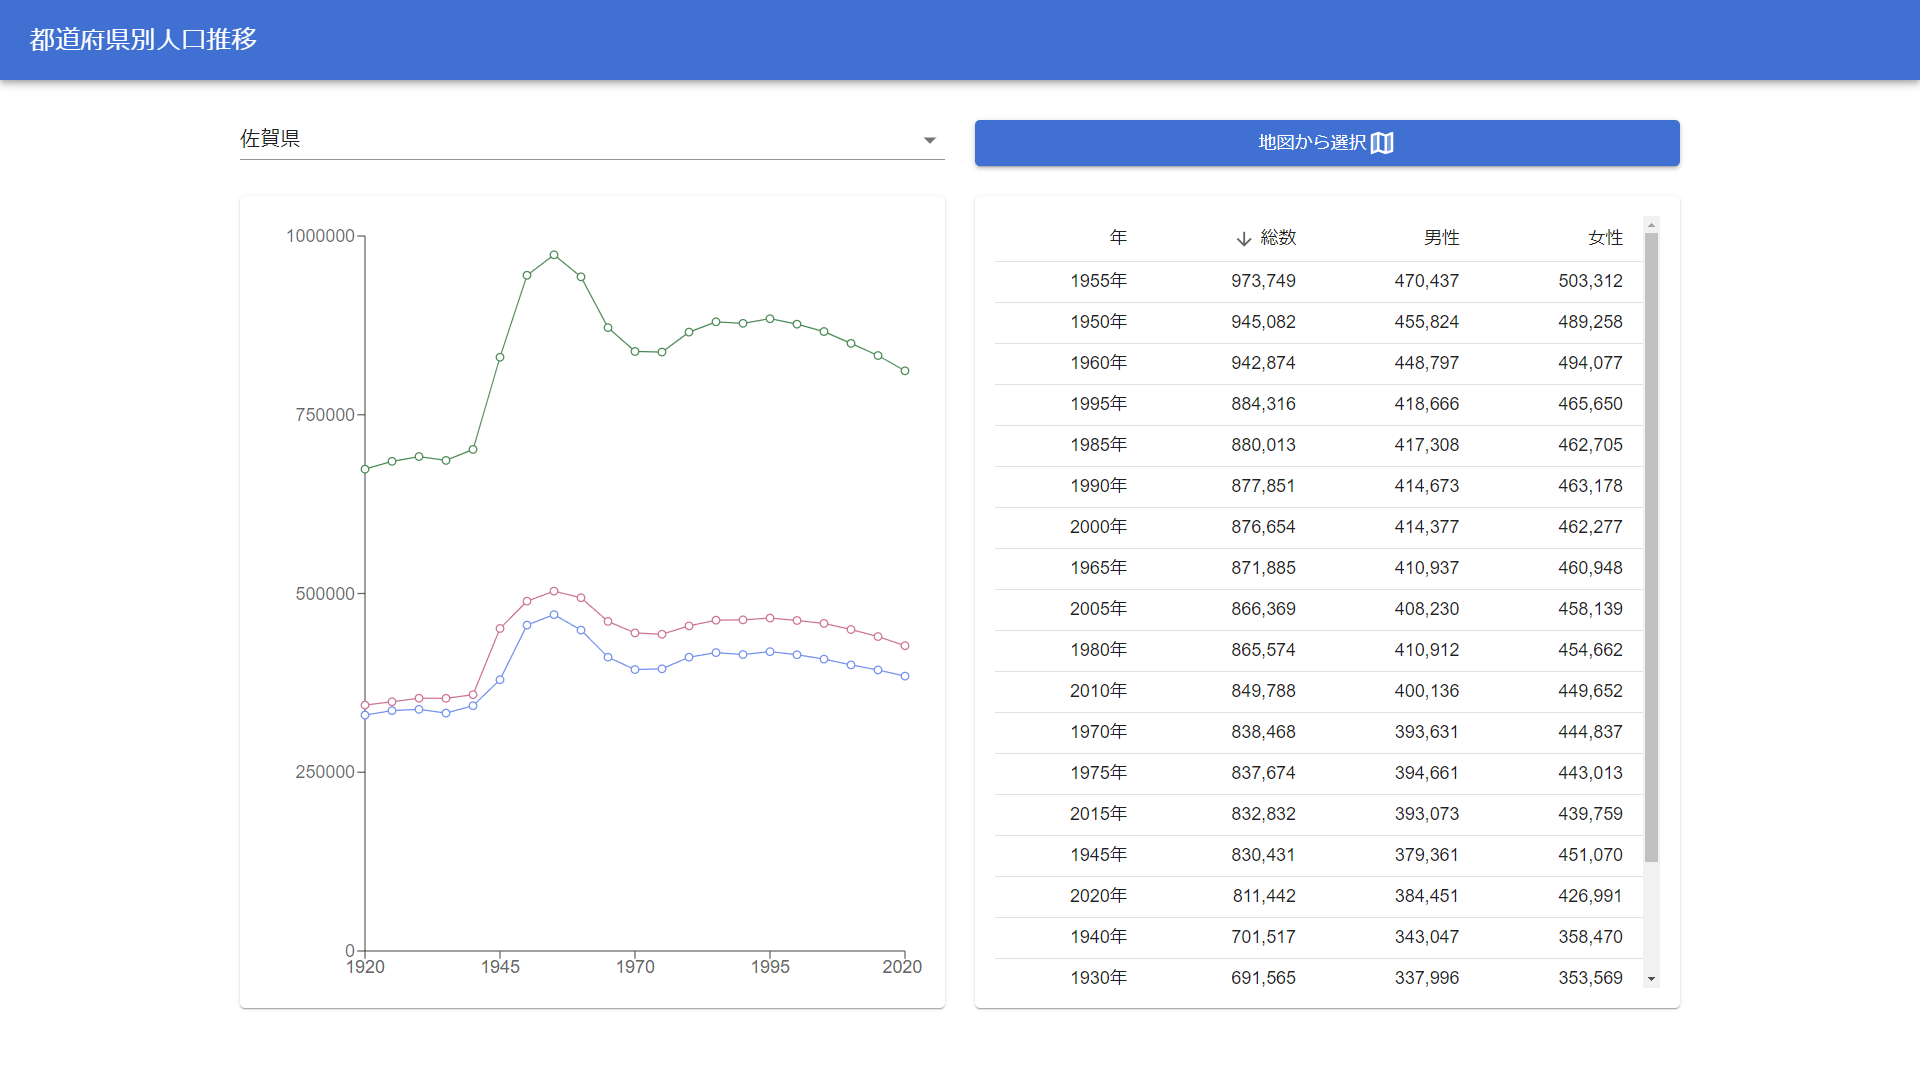
選択した都道府県の人口推移をグラフと表に表示します。
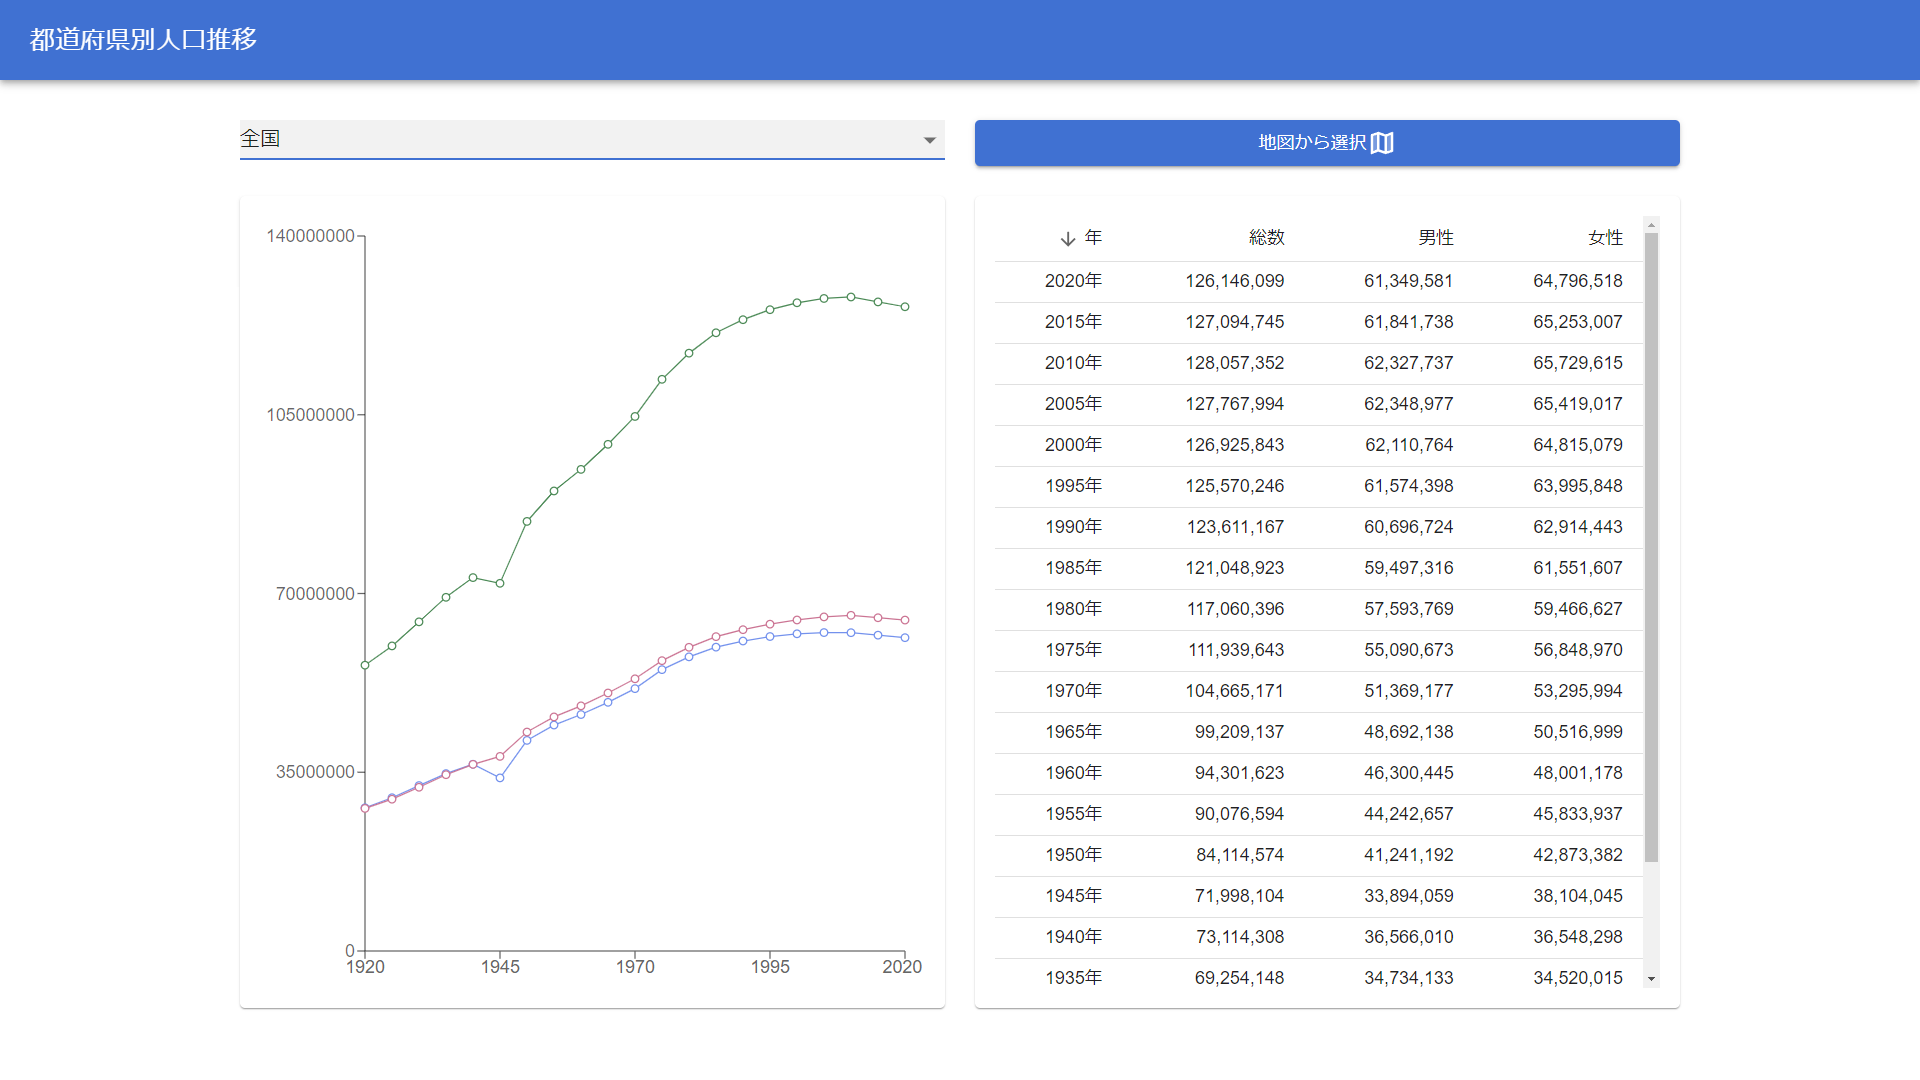
表示対象の都道府県は以下の方法で切り替えられます。
- プルダウンから都道府県を選択
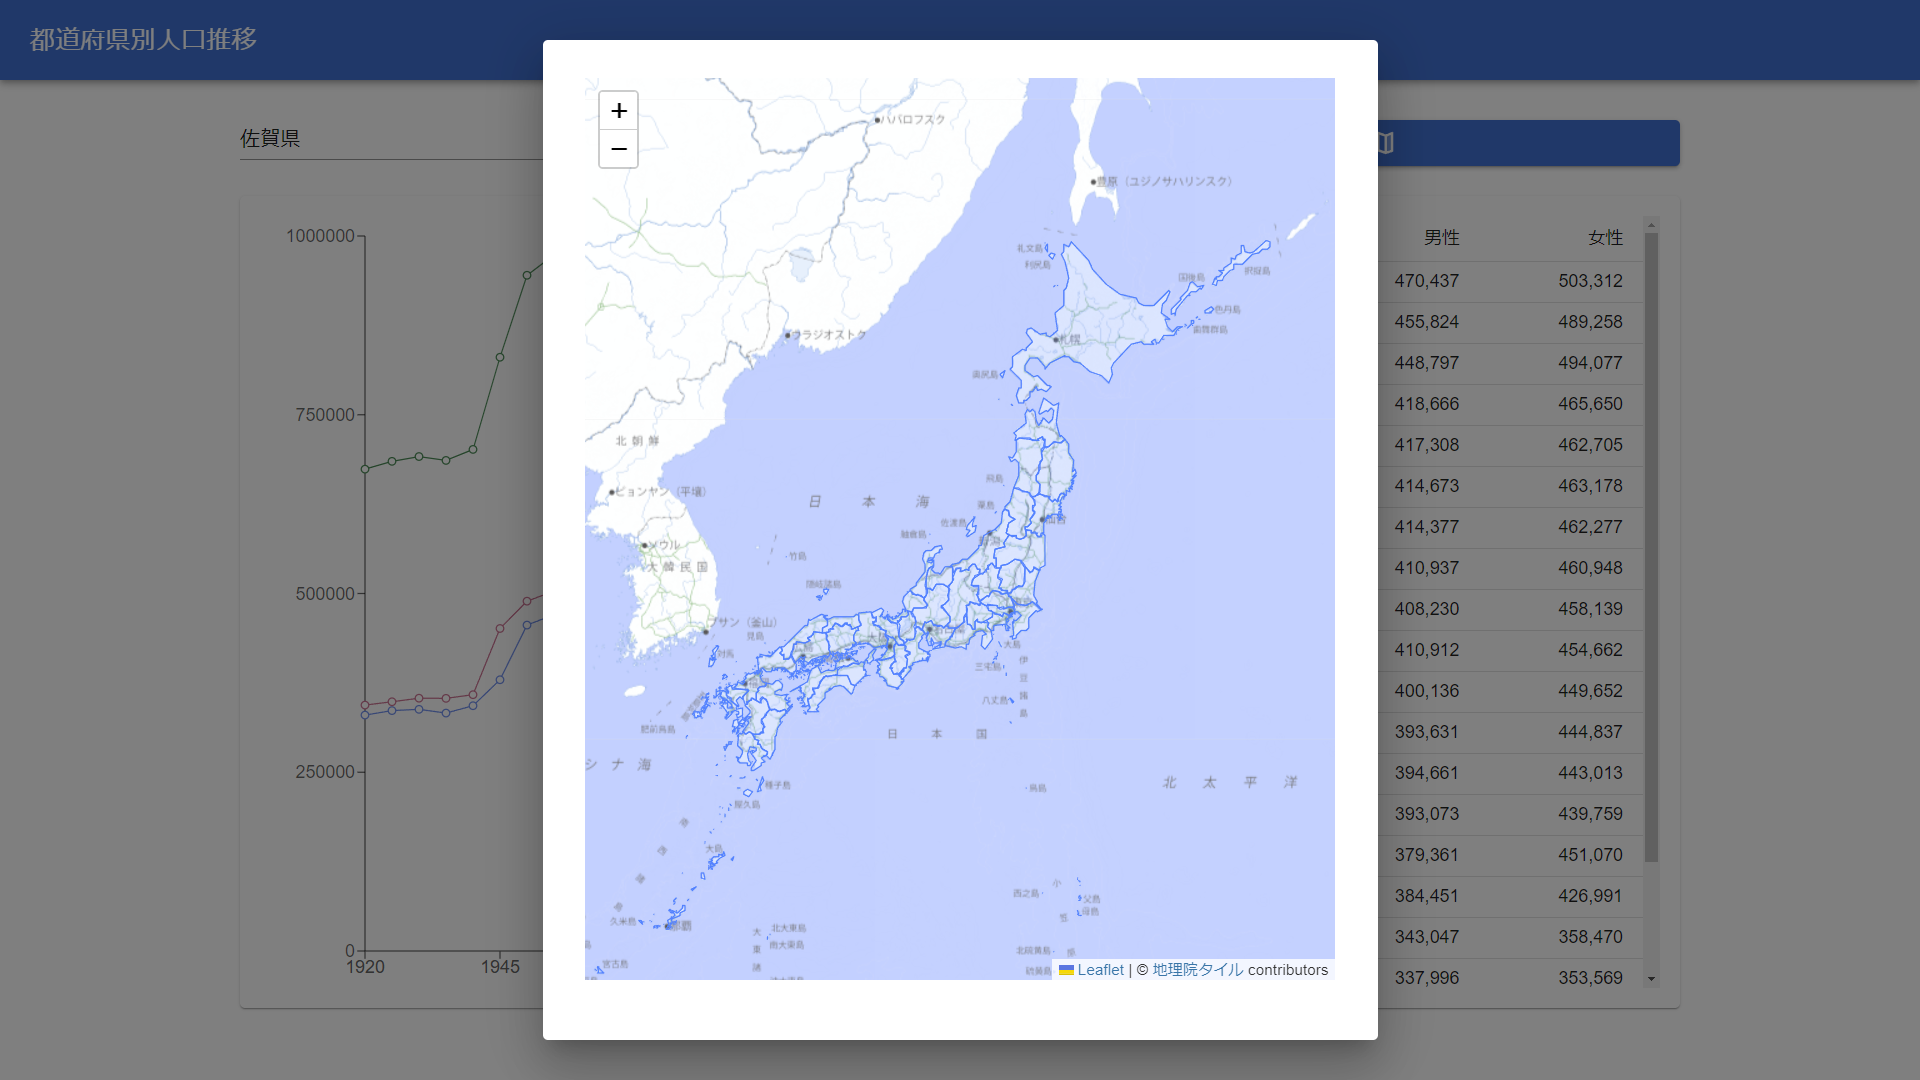
- 「地図から選択」押下で表示されるダイアログにて任意の地点を選択
表はヘッダー行の各項目を押下することでソート可能です。
統計データ取得
e-Stat(政府統計の総合窓口) とは、日本の各府省等が公表する統計データが閲覧できる政府統計ポータルサイトです。
以下の17分野のデータが公開されています。
- 国土・気象
- 人口・世帯
- 労働・賃金
- 農林水産業
- 鉱工業
- 商業・サービス業
- 企業・家計・経済
- 住宅・土地・建設
- エネルギー・水
- 運輸・観光
- 情報通信・科学技術
- 教育・文化・スポーツ・生活
- 行財政
- 司法・安全・環境
- 社会保障・衛生
- 国際
- その他
e-Statでは統計データを取得するためのAPIも提供しています。
ユーザ登録を行うことでアプリケーションIDが発行され、APIの利用が可能となります。
統計データはXML、JSON、CSV形式で提供されています。
本アプリでは 国勢調査の男女別人口及び人口性比データ を取得しています。
データ可視化
グラフ
Reactのチャートライブラリ Recharts を利用しています。
実装に際しては以下の記事を参考にさせていただきました。
表
Material UI の Table コンポーネントを利用しています。
ソートの項目および昇順/降順の状態は useState で管理し、ヘッダーの TableCell コンポーネントを押下した際に切り替わるようになっております。
import { useState } from 'react';

import { TableContainer, TableSortLabel } from '@mui/material';
import Table from '@mui/material/Table';
import TableBody from '@mui/material/TableBody';
import TableCell from '@mui/material/TableCell';
import TableHead from '@mui/material/TableHead';
import TableRow from '@mui/material/TableRow';

import { numberFormat } from '../util/util';

export type DataList = {
  year: number;
  total?: number;
  male?: number;
  female?: number;
};

export default function CustomTable(
  props: {
    dataList: DataList[];
  } = {
    dataList: [],
  }
) {
  const [sortOrder, setSortOrder] = useState<"asc" | "desc">("desc");
  const [sortItem, setSortItem] = useState<keyof DataList>("year");

  function CustomTableCell(props: {
    id: keyof DataList;
    label: string;
    align: "left" | "center" | "right";
  }) {
    return (
      <TableCell
        align={props.align}
        onClick={() => {
          // ソート変更
          setSortOrder(
            sortItem !== props.id || sortOrder === "desc" ? "asc" : "desc"
          );
          setSortItem(props.id);
        }}
        style={{ cursor: "pointer" }}
      >
        <TableSortLabel
          active={sortItem === props.id ? true : false}
          direction={sortOrder}
          hideSortIcon={true}
        />
        {props.label}
      </TableCell>
    );
  }

  return (
    <TableContainer sx={{ maxHeight: "100%" }}>
      <Table size="small" stickyHeader>
        <TableHead>
          <TableRow>
            <CustomTableCell id="year" label="年" align="right" />
            <CustomTableCell id="total" label="総数" align="right" />
            <CustomTableCell id="male" label="男性" align="right" />
            <CustomTableCell id="female" label="女性" align="right" />
          </TableRow>
        </TableHead>
        <TableBody style={{ height: "100", overflow: "hidden" }}>
          {props.dataList
            .sort((item1, item2) => {
              if (sortItem === undefined) {
                return 0;
              } else {
                const val1 = item1[sortItem] ?? 0;
                const val2 = item2[sortItem] ?? 0;
                return sortOrder === "asc" ? val1 - val2 : val2 - val1;
              }
            })
            .map((row) => (
              <TableRow key={row.year}>
                <TableCell
                  align="right"
                  key="year"
                >{`${row.year}年`}</TableCell>
                <TableCell align="right">{numberFormat(row.total)}</TableCell>
                <TableCell align="right">{numberFormat(row.male)}</TableCell>
                <TableCell align="right">{numberFormat(row.female)}</TableCell>
              </TableRow>
            ))}
        </TableBody>
      </Table>
    </TableContainer>
  );
}
マップ
地図を表示することができる JavaScript ライブラリの leaflet を React 向けに拡張した
React Leaflet を利用しております。
import 'leaflet/dist/leaflet.css';
import axios from 'axios';
import { LatLngLiteral } from 'leaflet';
import { useEffect, useState } from 'react';
import { GeoJSON, MapContainer, TileLayer, useMapEvents } from 'react-leaflet';
import { reverseGeocoder } from '../api/reverseGeocoder';
import type { GeoJsonObject } from "geojson";
interface Props {
height?: string | number;
width?: string | number;
setTodofukenCode: React.Dispatch<React.SetStateAction<string>>;
onClose: () => void;
zoom?: number;
setZoom: (val: number) => void;
latLng?: LatLngLiteral;
setLatLng: (val: LatLngLiteral) => void;
address?: string;
setAddress: (val: string) => void;
appid: string;
}
export default function CustomMap(
props: Props = {
height: "95%",
width: "95%",
setTodofukenCode: () => {},
onClose: () => {},
setZoom: () => {},
setLatLng: () => {},
setAddress: () => {},
appid: "",
}
) {
/** 47都道府県のポリゴンデータ */
const [geojson, setGeojson] = useState<GeoJsonObject>();
/** 初期表示時のフック */
useEffect(() => {
getGeojson();
}, []);
/**
* 47都道府県のポリゴンデータを読込
* https://japonyol.net/editor/article/47-prefectures-geojson.html
*/
const getGeojson = async () => {
const prefectures = await axios.get("./geojson/prefectures.geojson");
setGeojson(prefectures.data);
};
function MapEvent() {
useMapEvents({
async click(e) {
// クリックした座標から都道府県を取得
await reverseGeocoder({
appid: props.appid,
lat: String(e.latlng.lat),
lon: String(e.latlng.lng),
}).then((result) => {
if (result.existError) {
props.onClose();
} else if (result.code !== "") {
// 都道府県を取得できた場合
props.setTodofukenCode(result.code + "000");
props.setZoom(e.target.getZoom());
props.setLatLng(e.latlng);
props.setAddress(result.address);
props.onClose();
}
});
},
});
return <></>;
}
return (
<>
<MapContainer
center={props.latLng}
zoom={props.zoom}
style={{ height: props.height, width: props.width }}
doubleClickZoom={false}
>
<TileLayer
attribution='&copy <a href="https://maps.gsi.go.jp/development/ichiran.html">地理院タイル</a> contributors'
url="https://cyberjapandata.gsi.go.jp/xyz/pale/{z}/{x}/{y}.png"
/>
<MapEvent />
{/* 都道府県の境界線を設定 */}
{geojson ? <GeoJSON data={geojson} style={{ weight: 1 }} /> : <></>}
</MapContainer>
{props.address ? <span>前回選択した地点:{props.address}</span> : <></>}
</>
);
}
TileLayer コンポーネントの url にて地理院タイルを指定可能です。
地理院タイルとは国土地理院が配信しているタイル状の地図データです。
本アプリで採用している淡色地図のほか、航空写真や標高地図など様々な種別のものが配信されています。
ここで、もとの白地図はこのようになっており、都道府県の境界線が表示されておりません。
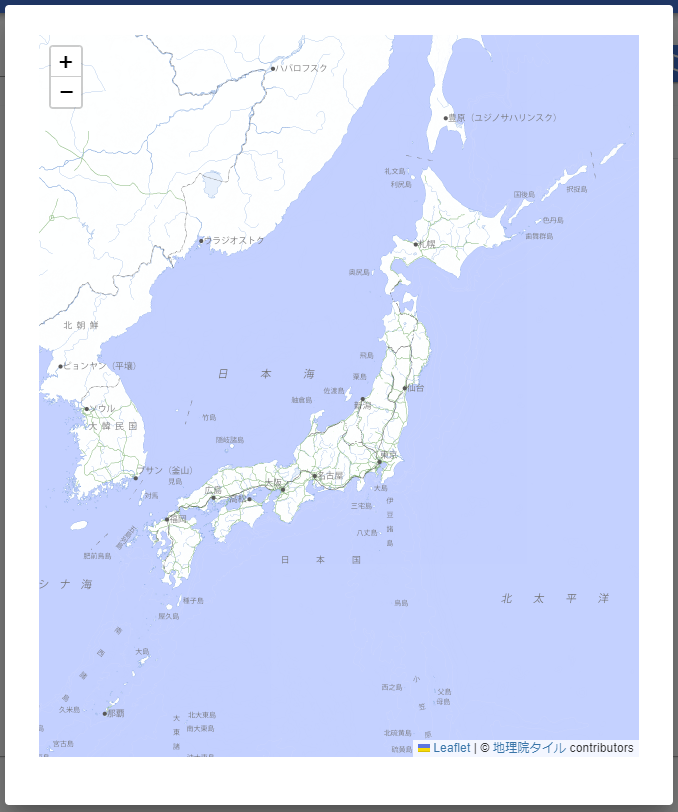
境界線を描画するためには、GeoJSON コンポーネントに各都道府県の境界線情報を含むポリゴンデータ渡す必要があります。
今回は以下のサイトで配布されているデータを利用させていただきました。
また、マップ上の任意の地点をクリックすると親画面にて選択している都道府県が切り替わりますが、こちらは Yahoo!リバースジオコーダAPI を利用しております。
APIに緯度と経度を渡すことで、その地点の住所の情報を返してくれます。
利用登録を行うことでClient IDが発行され、APIの利用が可能となります。
https://map.yahooapis.jp/geoapi/V1/reverseGeoCoder?appid={発行されたClient ID}&lat=34.67953630441794&lon=135.17911255359653&output=json&_=1706618559490&callback=axiosJsonpCallback1
axiosJsonpCallback1({
    "ResultInfo": {
        "Count": 1,
        "Total": 1,
        "Start": 1,
        "Latency": 0.004,
        "Status": 200,
        "Description": "指定の地点の住所情報を取得する機能を提供します。",
        "Copyright": "",
        "CompressType": ""
    },
    "Feature": [{
        "Geometry": {
            "Type": "point",
            "Coordinates": "135.17911255359653,34.67953630441794"
        },
        "Property": {
            "Country": {
                "Code": "JP",
                "Name": "日本"
            },
            "Address": "兵庫県神戸市中央区東川崎町1丁目2",
            "AddressElement": [{
                "Name": "兵庫県",
                "Kana": "ひょうごけん",
                "Level": "prefecture",
                "Code": "28"
            }, {
                "Name": "神戸市中央区",
                "Kana": "こうべしちゅうおうく",
                "Level": "city",
                "Code": "28110"
            }, {
                "Name": "東川崎町",
                "Kana": "ひがしかわさきちょう",
                "Level": "oaza"
            }, {
                "Name": "1丁目",
                "Kana": "1ちょうめ",
                "Level": "aza"
            }, {
                "Name": "2",
                "Kana": "2",
                "Level": "detail1"
            }]
        }
    }]
})
アプリ公開
GitHub Pages を利用してアプリを公開しております。
詳細は以下の記事にまとめております。
さて、本アプリでは2つの外部APIを利用しておりますが、これらのAPIキーはGitHubにはデプロイしたくありません。
そのため、URLクエリパラメータでAPIキーを受け取って利用する実装としております。
import { useLocation } from 'react-router-dom';

// URLパラメータ取得
const search = useLocation().search;
const urlSearchParams = new URLSearchParams(search);

/** 政府統計データ取得APIキー */
const getStatsDataAppId: string = urlSearchParams.get("getStatsDataAppId") ?? "";

/** YahooリバースジオコーダAPIキー */
const reverseGeocoderAppId: string = urlSearchParams.get("reverseGeocoderAppId") ?? "";
これにより、社内の勉強会などで限られたメンバーにだけアプリを動かしてもらいたい場面では以下のURLを共有すればOKです。
https://tora-83863.github.io/population-trend/?getStatsDataAppId={政府統計データ取得APIキー}&reverseGeocoderAppId={YahooリバースジオコーダAPIキー}