はじめに
Elasticsearchに取り込んだデータを可視化する場合、同じElastic社が提供しているKibanaでグラフを作ったりするケースがあると思いますが、パフォーマンス情報の可視化の場合はGrafanaが好まれるケースが多いような気がします。
一方ログをそのまま見るにはKibanaのDiscoverが手っ取り早いし扱いやすいように思います。
UIをGrafanaに統一してログの情報もGrafanaで見たいという場合に、LogsというViusualizeが使えそうなので試してみました。
環境
Linux(RHEL7.5)
Elasticsearch 7.6.2
Kibana 7.6.2
fluentd(td-agent) 1.0
Grafana 7.1.0
Grafana環境構築
Elasticsearch, Kibana, fluentdは別記事で触れているのでここではGrafanaについて記載します。
参考:
fluentd/Elasticsearch/kibanaを試す: (1)インストール
fluentdメモ - (1) インストール/簡易操作
Grafanaインストール
以下の記述に従ってインストール
参考: Install with RPM
[root@test08 /Inst_Image/grafana]# wget https://dl.grafana.com/oss/release/grafana-7.1.0-1.x86_64.rpm
--2020-07-22 09:02:13--  https://dl.grafana.com/oss/release/grafana-7.1.0-1.x86_64.rpm
dl.grafana.com (dl.grafana.com) をDNSに問いあわせています... 151.101.198.217, 2a04:4e42:d::729
dl.grafana.com (dl.grafana.com)|151.101.198.217|:443 に接続しています... 接続しました。
HTTP による接続要求を送信しました、応答を待っています... 200 OK
長さ: 52219308 (50M) [application/x-redhat-package-manager]
`grafana-7.1.0-1.x86_64.rpm' に保存中

100%[================================================================================>] 52,219,308  1001KB/s 時間 48s

2020-07-22 09:03:01 (1.04 MB/s) - `grafana-7.1.0-1.x86_64.rpm' へ保存完了 [52219308/52219308]


[root@test08 /Inst_Image/grafana]# yum install grafana-7.1.0-1.x86_64.rpm
読み込んだプラグイン:langpacks, product-id, search-disabled-repos, subscription-manager
This system is not registered with an entitlement server. You can use subscription-manager to register.
grafana-7.1.0-1.x86_64.rpm を調べています: grafana-7.1.0-1.x86_64
grafana-7.1.0-1.x86_64.rpm をインストール済みとして設定しています
依存性の解決をしています
--> トランザクションの確認を実行しています。
---> パッケージ grafana.x86_64 0:7.1.0-1 を インストール
--> 依存性解決を終了しました。
bintray--sbt-rpm                                                                                   | 1.3 kB  00:00:00
epel/x86_64/metalink                                                                               | 9.0 kB  00:00:00
epel/x86_64                                                                                        | 4.7 kB  00:00:00
epel/x86_64/updateinfo                                                                             | 1.0 MB  00:00:00
epel/x86_64/primary_db                                                                             | 6.9 MB  00:00:01
file:///run/media/root/RHEL-7.5%20Server.x86_64/repodata/repomd.xml: [Errno 14] curl#37 - "Couldn't open file /run/media/root/RHEL-7.5%20Server.x86_64/repodata/repomd.xml"
他のミラーを試します。
treasuredata/7Server/x86_64                                                                        | 2.9 kB  00:00:00

依存性を解決しました

==========================================================================================================================
 Package                  アーキテクチャー        バージョン               リポジトリー                              容量
==========================================================================================================================
インストール中:
 grafana                  x86_64                  7.1.0-1                  /grafana-7.1.0-1.x86_64                  162 M

トランザクションの要約
==========================================================================================================================
インストール  1 パッケージ

合計容量: 162 M
インストール容量: 162 M
Is this ok [y/d/N]: y
Downloading packages:
Running transaction check
Running transaction test
Transaction test succeeded
Running transaction
  インストール中          : grafana-7.1.0-1.x86_64                                                                    1/1
### NOT starting on installation, please execute the following statements to configure grafana to start automatically using systemd
 sudo /bin/systemctl daemon-reload
 sudo /bin/systemctl enable grafana-server.service
### You can start grafana-server by executing
 sudo /bin/systemctl start grafana-server.service
POSTTRANS: Running script
  検証中                  : grafana-7.1.0-1.x86_64                                                                    1/1

インストール:
  grafana.x86_64 0:7.1.0-1

完了しました!
構成
参考: Configuration
構成情報は /etc/grafana/grafana.iniファイルに保持されます。
デフォルトのgrafana.iniファイル
##################### Grafana Configuration Example #####################
#
# Everything has defaults so you only need to uncomment things you want to
# change

# possible values : production, development
;app_mode = production

# instance name, defaults to HOSTNAME environment variable value or hostname if HOSTNAME var is empty
;instance_name = ${HOSTNAME}

#################################### Paths ####################################
[paths]
# Path to where grafana can store temp files, sessions, and the sqlite3 db (if that is used)
;data = /var/lib/grafana

# Temporary files in `data` directory older than given duration will be removed
;temp_data_lifetime = 24h

# Directory where grafana can store logs
;logs = /var/log/grafana

# Directory where grafana will automatically scan and look for plugins
;plugins = /var/lib/grafana/plugins

# folder that contains provisioning config files that grafana will apply on startup and while running.
;provisioning = conf/provisioning

#################################### Server ####################################
[server]
# Protocol (http, https, h2, socket)
;protocol = http

# The ip address to bind to, empty will bind to all interfaces
;http_addr =

# The http port  to use
;http_port = 3000

# The public facing domain name used to access grafana from a browser
;domain = localhost

# Redirect to correct domain if host header does not match domain
# Prevents DNS rebinding attacks
;enforce_domain = false

# The full public facing url you use in browser, used for redirects and emails
# If you use reverse proxy and sub path specify full url (with sub path)
;root_url = %(protocol)s://%(domain)s:%(http_port)s/

# Serve Grafana from subpath specified in `root_url` setting. By default it is set to `false` for compatibility reasons.
;serve_from_sub_path = false

# Log web requests
;router_logging = false

# the path relative working path
;static_root_path = public

# enable gzip
;enable_gzip = false

# https certs & key file
;cert_file =
;cert_key =

# Unix socket path
;socket =

#################################### Database ####################################
[database]
# You can configure the database connection by specifying type, host, name, user and password
# as separate properties or as on string using the url properties.

# Either "mysql", "postgres" or "sqlite3", it's your choice
;type = sqlite3
;host = 127.0.0.1:3306
;name = grafana
;user = root
# If the password contains # or ; you have to wrap it with triple quotes. Ex """#password;"""
;password =

# Use either URL or the previous fields to configure the database
# Example: mysql://user:secret@host:port/database
;url =

# For "postgres" only, either "disable", "require" or "verify-full"
;ssl_mode = disable

;ca_cert_path =
;client_key_path =
;client_cert_path =
;server_cert_name =

# For "sqlite3" only, path relative to data_path setting
;path = grafana.db

# Max idle conn setting default is 2
;max_idle_conn = 2

# Max conn setting default is 0 (mean not set)
;max_open_conn =

# Connection Max Lifetime default is 14400 (means 14400 seconds or 4 hours)
;conn_max_lifetime = 14400

# Set to true to log the sql calls and execution times.
;log_queries =

# For "sqlite3" only. cache mode setting used for connecting to the database. (private, shared)
;cache_mode = private

#################################### Cache server #############################
[remote_cache]
# Either "redis", "memcached" or "database" default is "database"
;type = database

# cache connectionstring options
# database: will use Grafana primary database.
# redis: config like redis server e.g. `addr=127.0.0.1:6379,pool_size=100,db=0,ssl=false`. Only addr is required. ssl may be 'true', 'false', or 'insecure'.
# memcache: 127.0.0.1:11211
;connstr =

#################################### Data proxy ###########################
[dataproxy]

# This enables data proxy logging, default is false
;logging = false

# How long the data proxy waits before timing out, default is 30 seconds.
# This setting also applies to core backend HTTP data sources where query requests use an HTTP client with timeout set.
;timeout = 30

# If enabled and user is not anonymous, data proxy will add X-Grafana-User header with username into the request, default is false.
;send_user_header = false

#################################### Analytics ####################################
[analytics]
# Server reporting, sends usage counters to stats.grafana.org every 24 hours.
# No ip addresses are being tracked, only simple counters to track
# running instances, dashboard and error counts. It is very helpful to us.
# Change this option to false to disable reporting.
;reporting_enabled = true

# Set to false to disable all checks to https://grafana.net
# for new versions (grafana itself and plugins), check is used
# in some UI views to notify that grafana or plugin update exists
# This option does not cause any auto updates, nor send any information
# only a GET request to http://grafana.com to get latest versions
;check_for_updates = true

# Google Analytics universal tracking code, only enabled if you specify an id here
;google_analytics_ua_id =

# Google Tag Manager ID, only enabled if you specify an id here
;google_tag_manager_id =

#################################### Security ####################################
[security]
# disable creation of admin user on first start of grafana
;disable_initial_admin_creation = false

# default admin user, created on startup
;admin_user = admin

# default admin password, can be changed before first start of grafana,  or in profile settings
;admin_password = admin

# used for signing
;secret_key = SW2YcwTIb9zpOOhoPsMm

# disable gravatar profile images
;disable_gravatar = false

# data source proxy whitelist (ip_or_domain:port separated by spaces)
;data_source_proxy_whitelist =

# disable protection against brute force login attempts
;disable_brute_force_login_protection = false

# set to true if you host Grafana behind HTTPS. default is false.
;cookie_secure = false

# set cookie SameSite attribute. defaults to `lax`. can be set to "lax", "strict", "none" and "disabled"
;cookie_samesite = lax

# set to true if you want to allow browsers to render Grafana in a <frame>, <iframe>, <embed> or <object>. default is false.
;allow_embedding = false

# Set to true if you want to enable http strict transport security (HSTS) response header.
# This is only sent when HTTPS is enabled in this configuration.
# HSTS tells browsers that the site should only be accessed using HTTPS.
;strict_transport_security = false

# Sets how long a browser should cache HSTS. Only applied if strict_transport_security is enabled.
;strict_transport_security_max_age_seconds = 86400

# Set to true if to enable HSTS preloading option. Only applied if strict_transport_security is enabled.
;strict_transport_security_preload = false

# Set to true if to enable the HSTS includeSubDomains option. Only applied if strict_transport_security is enabled.
;strict_transport_security_subdomains = false

# Set to true to enable the X-Content-Type-Options response header.
# The X-Content-Type-Options response HTTP header is a marker used by the server to indicate that the MIME types advertised
# in the Content-Type headers should not be changed and be followed.
;x_content_type_options = true

# Set to true to enable the X-XSS-Protection header, which tells browsers to stop pages from loading
# when they detect reflected cross-site scripting (XSS) attacks.
;x_xss_protection = true

#################################### Snapshots ###########################
[snapshots]
# snapshot sharing options
;external_enabled = true
;external_snapshot_url = https://snapshots-origin.raintank.io
;external_snapshot_name = Publish to snapshot.raintank.io

# Set to true to enable this Grafana instance act as an external snapshot server and allow unauthenticated requests for
# creating and deleting snapshots.
;public_mode = false

# remove expired snapshot
;snapshot_remove_expired = true

#################################### Dashboards History ##################
[dashboards]
# Number dashboard versions to keep (per dashboard). Default: 20, Minimum: 1
;versions_to_keep = 20

# Minimum dashboard refresh interval. When set, this will restrict users to set the refresh interval of a dashboard lower than given interval. Per default this is 5 seconds.
# The interval string is a possibly signed sequence of decimal numbers, followed by a unit suffix (ms, s, m, h, d), e.g. 30s or 1m.
;min_refresh_interval = 5s

# Path to the default home dashboard. If this value is empty, then Grafana uses StaticRootPath + "dashboards/home.json"
;default_home_dashboard_path =

#################################### Users ###############################
[users]
# disable user signup / registration
;allow_sign_up = true

# Allow non admin users to create organizations
;allow_org_create = true

# Set to true to automatically assign new users to the default organization (id 1)
;auto_assign_org = true

# Set this value to automatically add new users to the provided organization (if auto_assign_org above is set to true)
;auto_assign_org_id = 1

# Default role new users will be automatically assigned (if disabled above is set to true)
;auto_assign_org_role = Viewer

# Require email validation before sign up completes
;verify_email_enabled = false

# Background text for the user field on the login page
;login_hint = email or username
;password_hint = password

# Default UI theme ("dark" or "light")
;default_theme = dark

# External user management, these options affect the organization users view
;external_manage_link_url =
;external_manage_link_name =
;external_manage_info =

# Viewers can edit/inspect dashboard settings in the browser. But not save the dashboard.
;viewers_can_edit = false

# Editors can administrate dashboard, folders and teams they create
;editors_can_admin = false

[auth]
# Login cookie name
;login_cookie_name = grafana_session

# The lifetime (days) an authenticated user can be inactive before being required to login at next visit. Default is 7 days,
;login_maximum_inactive_lifetime_days = 7

# The maximum lifetime (days) an authenticated user can be logged in since login time before being required to login. Default is 30 days.
;login_maximum_lifetime_days = 30

# How often should auth tokens be rotated for authenticated users when being active. The default is each 10 minutes.
;token_rotation_interval_minutes = 10

# Set to true to disable (hide) the login form, useful if you use OAuth, defaults to false
;disable_login_form = false

# Set to true to disable the signout link in the side menu. useful if you use auth.proxy, defaults to false
;disable_signout_menu = false

# URL to redirect the user to after sign out
;signout_redirect_url =

# Set to true to attempt login with OAuth automatically, skipping the login screen.
# This setting is ignored if multiple OAuth providers are configured.
;oauth_auto_login = false

# OAuth state max age cookie duration. Defaults to 60 seconds.
;oauth_state_cookie_max_age = 60

# limit of api_key seconds to live before expiration
;api_key_max_seconds_to_live = -1

#################################### Anonymous Auth ######################
[auth.anonymous]
# enable anonymous access
;enabled = false

# specify organization name that should be used for unauthenticated users
;org_name = Main Org.

# specify role for unauthenticated users
;org_role = Viewer

# mask the Grafana version number for unauthenticated users
;hide_version = false

#################################### Github Auth ##########################
[auth.github]
;enabled = false
;allow_sign_up = true
;client_id = some_id
;client_secret = some_secret
;scopes = user:email,read:org
;auth_url = https://github.com/login/oauth/authorize
;token_url = https://github.com/login/oauth/access_token
;api_url = https://api.github.com/user
;allowed_domains =
;team_ids =
;allowed_organizations =

#################################### GitLab Auth #########################
[auth.gitlab]
;enabled = false
;allow_sign_up = true
;client_id = some_id
;client_secret = some_secret
;scopes = api
;auth_url = https://gitlab.com/oauth/authorize
;token_url = https://gitlab.com/oauth/token
;api_url = https://gitlab.com/api/v4
;allowed_domains =
;allowed_groups =

#################################### Google Auth ##########################
[auth.google]
;enabled = false
;allow_sign_up = true
;client_id = some_client_id
;client_secret = some_client_secret
;scopes = https://www.googleapis.com/auth/userinfo.profile https://www.googleapis.com/auth/userinfo.email
;auth_url = https://accounts.google.com/o/oauth2/auth
;token_url = https://accounts.google.com/o/oauth2/token
;api_url = https://www.googleapis.com/oauth2/v1/userinfo
;allowed_domains =
;hosted_domain =

#################################### Grafana.com Auth ####################
[auth.grafana_com]
;enabled = false
;allow_sign_up = true
;client_id = some_id
;client_secret = some_secret
;scopes = user:email
;allowed_organizations =

#################################### Azure AD OAuth #######################
[auth.azuread]
;name = Azure AD
;enabled = false
;allow_sign_up = true
;client_id = some_client_id
;client_secret = some_client_secret
;scopes = openid email profile
;auth_url = https://login.microsoftonline.com/<tenant-id>/oauth2/v2.0/authorize
;token_url = https://login.microsoftonline.com/<tenant-id>/oauth2/v2.0/token
;allowed_domains =
;allowed_groups =

#################################### Okta OAuth #######################
[auth.okta]
;name = Okta
;enabled = false
;allow_sign_up = true
;client_id = some_id
;client_secret = some_secret
;scopes = openid profile email groups
;auth_url = https://<tenant-id>.okta.com/oauth2/v1/authorize
;token_url = https://<tenant-id>.okta.com/oauth2/v1/token
;api_url = https://<tenant-id>.okta.com/oauth2/v1/userinfo
;allowed_domains =
;allowed_groups =
;role_attribute_path =

#################################### Generic OAuth ##########################
[auth.generic_oauth]
;enabled = false
;name = OAuth
;allow_sign_up = true
;client_id = some_id
;client_secret = some_secret
;scopes = user:email,read:org
;email_attribute_name = email:primary
;email_attribute_path =
;auth_url = https://foo.bar/login/oauth/authorize
;token_url = https://foo.bar/login/oauth/access_token
;api_url = https://foo.bar/user
;allowed_domains =
;team_ids =
;allowed_organizations =
;role_attribute_path =
;tls_skip_verify_insecure = false
;tls_client_cert =
;tls_client_key =
;tls_client_ca =

#################################### Basic Auth ##########################
[auth.basic]
;enabled = true

#################################### Auth Proxy ##########################
[auth.proxy]
;enabled = false
;header_name = X-WEBAUTH-USER
;header_property = username
;auto_sign_up = true
;sync_ttl = 60
;whitelist = 192.168.1.1, 192.168.2.1
;headers = Email:X-User-Email, Name:X-User-Name
# Read the auth proxy docs for details on what the setting below enables
;enable_login_token = false

#################################### Auth LDAP ##########################
[auth.ldap]
;enabled = false
;config_file = /etc/grafana/ldap.toml
;allow_sign_up = true

# LDAP backround sync (Enterprise only)
# At 1 am every day
;sync_cron = "0 0 1 * * *"
;active_sync_enabled = true

#################################### SMTP / Emailing ##########################
[smtp]
;enabled = false
;host = localhost:25
;user =
# If the password contains # or ; you have to wrap it with triple quotes. Ex """#password;"""
;password =
;cert_file =
;key_file =
;skip_verify = false
;from_address = admin@grafana.localhost
;from_name = Grafana
# EHLO identity in SMTP dialog (defaults to instance_name)
;ehlo_identity = dashboard.example.com
# SMTP startTLS policy (defaults to 'OpportunisticStartTLS')
;startTLS_policy = NoStartTLS

[emails]
;welcome_email_on_sign_up = false
;templates_pattern = emails/*.html

#################################### Logging ##########################
[log]
# Either "console", "file", "syslog". Default is console and  file
# Use space to separate multiple modes, e.g. "console file"
;mode = console file

# Either "debug", "info", "warn", "error", "critical", default is "info"
;level = info

# optional settings to set different levels for specific loggers. Ex filters = sqlstore:debug
;filters =

# For "console" mode only
[log.console]
;level =

# log line format, valid options are text, console and json
;format = console

# For "file" mode only
[log.file]
;level =

# log line format, valid options are text, console and json
;format = text

# This enables automated log rotate(switch of following options), default is true
;log_rotate = true

# Max line number of single file, default is 1000000
;max_lines = 1000000

# Max size shift of single file, default is 28 means 1 << 28, 256MB
;max_size_shift = 28

# Segment log daily, default is true
;daily_rotate = true

# Expired days of log file(delete after max days), default is 7
;max_days = 7

[log.syslog]
;level =

# log line format, valid options are text, console and json
;format = text

# Syslog network type and address. This can be udp, tcp, or unix. If left blank, the default unix endpoints will be used.
;network =
;address =

# Syslog facility. user, daemon and local0 through local7 are valid.
;facility =

# Syslog tag. By default, the process' argv[0] is used.
;tag =

#################################### Usage Quotas ########################
[quota]
; enabled = false

#### set quotas to -1 to make unlimited. ####
# limit number of users per Org.
; org_user = 10

# limit number of dashboards per Org.
; org_dashboard = 100

# limit number of data_sources per Org.
; org_data_source = 10

# limit number of api_keys per Org.
; org_api_key = 10

# limit number of orgs a user can create.
; user_org = 10

# Global limit of users.
; global_user = -1

# global limit of orgs.
; global_org = -1

# global limit of dashboards
; global_dashboard = -1

# global limit of api_keys
; global_api_key = -1

# global limit on number of logged in users.
; global_session = -1

#################################### Alerting ############################
[alerting]
# Disable alerting engine & UI features
;enabled = true
# Makes it possible to turn off alert rule execution but alerting UI is visible
;execute_alerts = true

# Default setting for new alert rules. Defaults to categorize error and timeouts as alerting. (alerting, keep_state)
;error_or_timeout = alerting

# Default setting for how Grafana handles nodata or null values in alerting. (alerting, no_data, keep_state, ok)
;nodata_or_nullvalues = no_data

# Alert notifications can include images, but rendering many images at the same time can overload the server
# This limit will protect the server from render overloading and make sure notifications are sent out quickly
;concurrent_render_limit = 5


# Default setting for alert calculation timeout. Default value is 30
;evaluation_timeout_seconds = 30

# Default setting for alert notification timeout. Default value is 30
;notification_timeout_seconds = 30

# Default setting for max attempts to sending alert notifications. Default value is 3
;max_attempts = 3

# Makes it possible to enforce a minimal interval between evaluations, to reduce load on the backend
;min_interval_seconds = 1

#################################### Explore #############################
[explore]
# Enable the Explore section
;enabled = true

#################################### Internal Grafana Metrics ##########################
# Metrics available at HTTP API Url /metrics
[metrics]
# Disable / Enable internal metrics
;enabled           = true
# Graphite Publish interval
;interval_seconds  = 10
# Disable total stats (stat_totals_*) metrics to be generated
;disable_total_stats = false

# If both are set, basic auth will be required for the metrics endpoint.
; basic_auth_username =
; basic_auth_password =

# Send internal metrics to Graphite
[metrics.graphite]
# Enable by setting the address setting (ex localhost:2003)
;address =
;prefix = prod.grafana.%(instance_name)s.

#################################### Grafana.com integration  ##########################
# Url used to import dashboards directly from Grafana.com
[grafana_com]
;url = https://grafana.com

#################################### Distributed tracing ############
[tracing.jaeger]
# Enable by setting the address sending traces to jaeger (ex localhost:6831)
;address = localhost:6831
# Tag that will always be included in when creating new spans. ex (tag1:value1,tag2:value2)
;always_included_tag = tag1:value1
# Type specifies the type of the sampler: const, probabilistic, rateLimiting, or remote
;sampler_type = const
# jaeger samplerconfig param
# for "const" sampler, 0 or 1 for always false/true respectively
# for "probabilistic" sampler, a probability between 0 and 1
# for "rateLimiting" sampler, the number of spans per second
# for "remote" sampler, param is the same as for "probabilistic"
# and indicates the initial sampling rate before the actual one
# is received from the mothership
;sampler_param = 1
# Whether or not to use Zipkin propagation (x-b3- HTTP headers).
;zipkin_propagation = false
# Setting this to true disables shared RPC spans.
# Not disabling is the most common setting when using Zipkin elsewhere in your infrastructure.
;disable_shared_zipkin_spans = false

#################################### External image storage ##########################
[external_image_storage]
# Used for uploading images to public servers so they can be included in slack/email messages.
# you can choose between (s3, webdav, gcs, azure_blob, local)
;provider =

[external_image_storage.s3]
;endpoint =
;path_style_access =
;bucket =
;region =
;path =
;access_key =
;secret_key =

[external_image_storage.webdav]
;url =
;public_url =
;username =
;password =

[external_image_storage.gcs]
;key_file =
;bucket =
;path =

[external_image_storage.azure_blob]
;account_name =
;account_key =
;container_name =

[external_image_storage.local]
# does not require any configuration

[rendering]
# Options to configure a remote HTTP image rendering service, e.g. using https://github.com/grafana/grafana-image-renderer.
# URL to a remote HTTP image renderer service, e.g. http://localhost:8081/render, will enable Grafana to render panels and dashboards to PNG-images using HTTP requests to an external service.
;server_url =
# If the remote HTTP image renderer service runs on a different server than the Grafana server you may have to configure this to a URL where Grafana is reachable, e.g. http://grafana.domain/.
;callback_url =
# Concurrent render request limit affects when the /render HTTP endpoint is used. Rendering many images at the same time can overload the server,
# which this setting can help protect against by only allowing a certain amount of concurrent requests.
;concurrent_render_request_limit = 30

[panels]
# If set to true Grafana will allow script tags in text panels. Not recommended as it enable XSS vulnerabilities.
;disable_sanitize_html = false

[plugins]
;enable_alpha = false
;app_tls_skip_verify_insecure = false
# Enter a comma-separated list of plugin identifiers to identify plugins that are allowed to be loaded even if they lack a valid signature.
;allow_loading_unsigned_plugins =

#################################### Grafana Image Renderer Plugin ##########################
[plugin.grafana-image-renderer]
# Instruct headless browser instance to use a default timezone when not provided by Grafana, e.g. when rendering panel image of alert.
# See ICU’s metaZones.txt (https://cs.chromium.org/chromium/src/third_party/icu/source/data/misc/metaZones.txt) for a list of supported
# timezone IDs. Fallbacks to TZ environment variable if not set.
;rendering_timezone =

# Instruct headless browser instance to use a default language when not provided by Grafana, e.g. when rendering panel image of alert.
# Please refer to the HTTP header Accept-Language to understand how to format this value, e.g. 'fr-CH, fr;q=0.9, en;q=0.8, de;q=0.7, *;q=0.5'.
;rendering_language =

# Instruct headless browser instance to use a default device scale factor when not provided by Grafana, e.g. when rendering panel image of alert.
# Default is 1. Using a higher value will produce more detailed images (higher DPI), but will require more disk space to store an image.
;rendering_viewport_device_scale_factor =

# Instruct headless browser instance whether to ignore HTTPS errors during navigation. Per default HTTPS errors are not ignored. Due to
# the security risk it's not recommended to ignore HTTPS errors.
;rendering_ignore_https_errors =

# Instruct headless browser instance whether to capture and log verbose information when rendering an image. Default is false and will
# only capture and log error messages. When enabled, debug messages are captured and logged as well.
# For the verbose information to be included in the Grafana server log you have to adjust the rendering log level to debug, configure
# [log].filter = rendering:debug.
;rendering_verbose_logging =

# Instruct headless browser instance whether to output its debug and error messages into running process of remote rendering service.
# Default is false. This can be useful to enable (true) when troubleshooting.
;rendering_dumpio =

# Additional arguments to pass to the headless browser instance. Default is --no-sandbox. The list of Chromium flags can be found
# here (https://peter.sh/experiments/chromium-command-line-switches/). Multiple arguments is separated with comma-character.
;rendering_args =

# You can configure the plugin to use a different browser binary instead of the pre-packaged version of Chromium.
# Please note that this is not recommended, since you may encounter problems if the installed version of Chrome/Chromium is not
# compatible with the plugin.
;rendering_chrome_bin =

# Instruct how headless browser instances are created. Default is 'default' and will create a new browser instance on each request.
# Mode 'clustered' will make sure that only a maximum of browsers/incognito pages can execute concurrently.
# Mode 'reusable' will have one browser instance and will create a new incognito page on each request.
;rendering_mode =

# When rendering_mode = clustered you can instruct how many browsers or incognito pages can execute concurrently. Default is 'browser'
# and will cluster using browser instances.
# Mode 'context' will cluster using incognito pages.
;rendering_clustering_mode =
# When rendering_mode = clustered you can define maximum number of browser instances/incognito pages that can execute concurrently..
;rendering_clustering_max_concurrency =

# Limit the maximum viewport width, height and device scale factor that can be requested.
;rendering_viewport_max_width =
;rendering_viewport_max_height =
;rendering_viewport_max_device_scale_factor =

# Change the listening host and port of the gRPC server. Default host is 127.0.0.1 and default port is 0 and will automatically assign
# a port not in use.
;grpc_host =
;grpc_port =

[enterprise]
# Path to a valid Grafana Enterprise license.jwt file
;license_path =

[feature_toggles]
# enable features, separated by spaces
;enable =
とりあえずここでは構成ファイルの変更は何も行いません(デフォルトのまま)。
3000番ポートをそのまま使うので、firewallの穴開けておきます。
[root@test08 /etc/grafana]# firewall-cmd --zone=public --add-port=3000/tcp --permanent
success
[root@test08 /etc/grafana]# firewall-cmd --reload
success
サーバー操作
起動/停止はsystemctlで実施
[root@test08 /etc/grafana]# systemctl start grafana-server
[root@test08 /etc/grafana]# systemctl status grafana-server
● grafana-server.service - Grafana instance
   Loaded: loaded (/usr/lib/systemd/system/grafana-server.service; disabled; vendor preset: disabled)
   Active: active (running) since 水 2020-07-22 09:18:34 JST; 25s ago
     Docs: http://docs.grafana.org
 Main PID: 5965 (grafana-server)
    Tasks: 11
   CGroup: /system.slice/grafana-server.service
           mq5965 /usr/sbin/grafana-server --config=/etc/grafana/grafana.ini --pidfile=/var/run/grafana/grafana-server....

 7月 22 09:18:34 test08 grafana-server[5965]: t=2020-07-22T09:18:34+0900 lvl=info msg="Executing migration" logge...oken"
 7月 22 09:18:34 test08 grafana-server[5965]: t=2020-07-22T09:18:34+0900 lvl=info msg="Executing migration" logge...oken"
 7月 22 09:18:34 test08 grafana-server[5965]: t=2020-07-22T09:18:34+0900 lvl=info msg="Executing migration" logge...able"
 7月 22 09:18:34 test08 grafana-server[5965]: t=2020-07-22T09:18:34+0900 lvl=info msg="Executing migration" logge..._key"
 7月 22 09:18:34 test08 grafana-server[5965]: t=2020-07-22T09:18:34+0900 lvl=info msg="Created default admin" log...admin
 7月 22 09:18:34 test08 grafana-server[5965]: t=2020-07-22T09:18:34+0900 lvl=info msg="Starting plugin search" lo...ugins
 7月 22 09:18:34 test08 grafana-server[5965]: t=2020-07-22T09:18:34+0900 lvl=info msg="Registering plugin" logger...nput"
 7月 22 09:18:34 test08 grafana-server[5965]: t=2020-07-22T09:18:34+0900 lvl=info msg="External plugins directory...ugins
 7月 22 09:18:34 test08 systemd[1]: Started Grafana instance.
 7月 22 09:18:34 test08 grafana-server[5965]: t=2020-07-22T09:18:34+0900 lvl=info msg="HTTP Server Listen" logger...cket=
Hint: Some lines were ellipsized, use -l to show in full.
[root@test08 /etc/grafana]# systemctl stop grafana-server
ログイン
ブラウザから当該サーバーのポート3000にアクセスします。
ログイン画面になるので、admin/adminでログイン
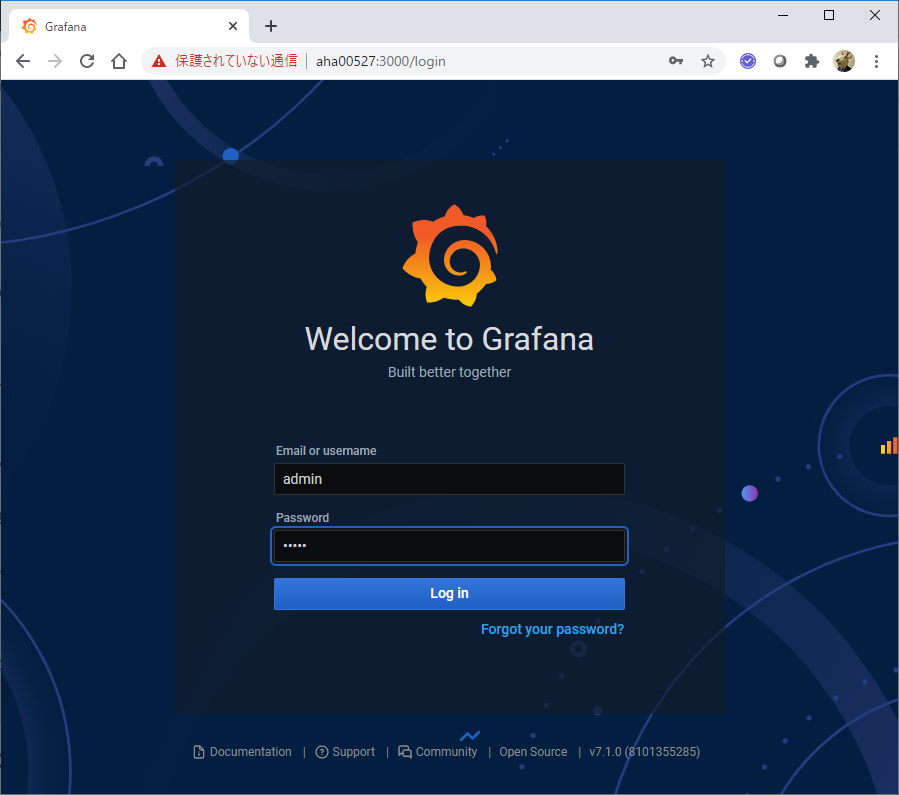
新しいパスワード設定を促されるので、パスワードを設定
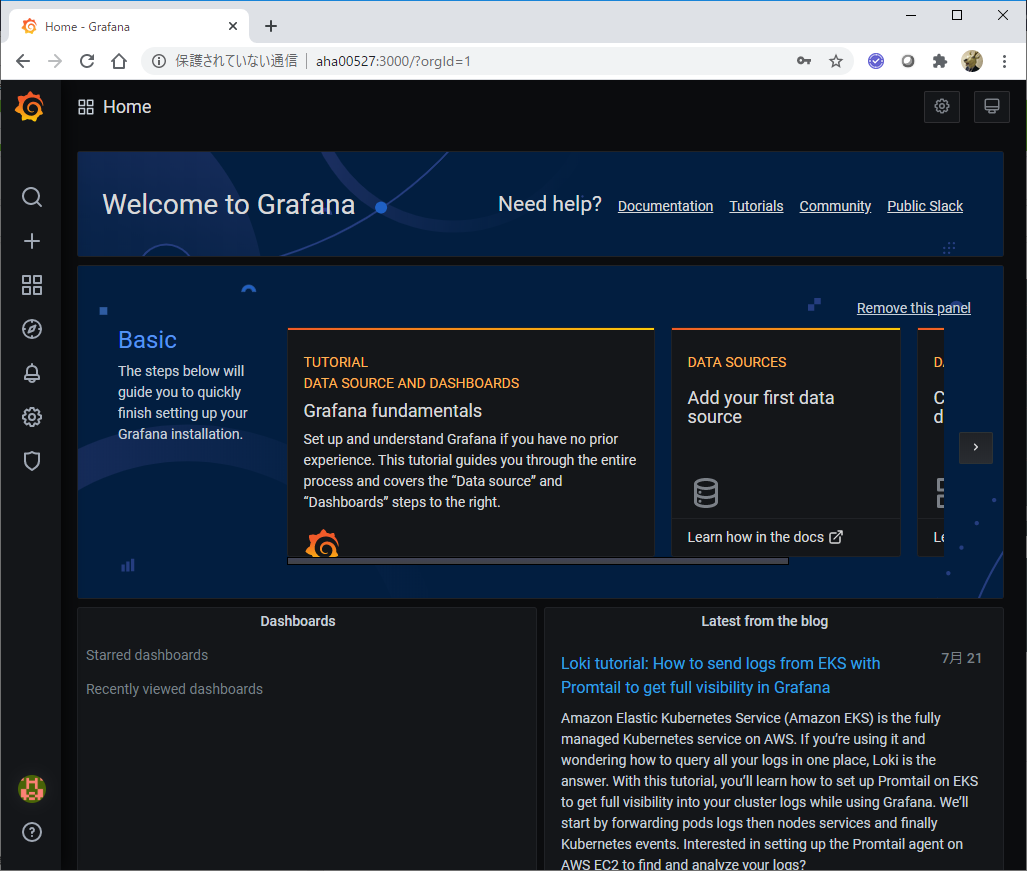
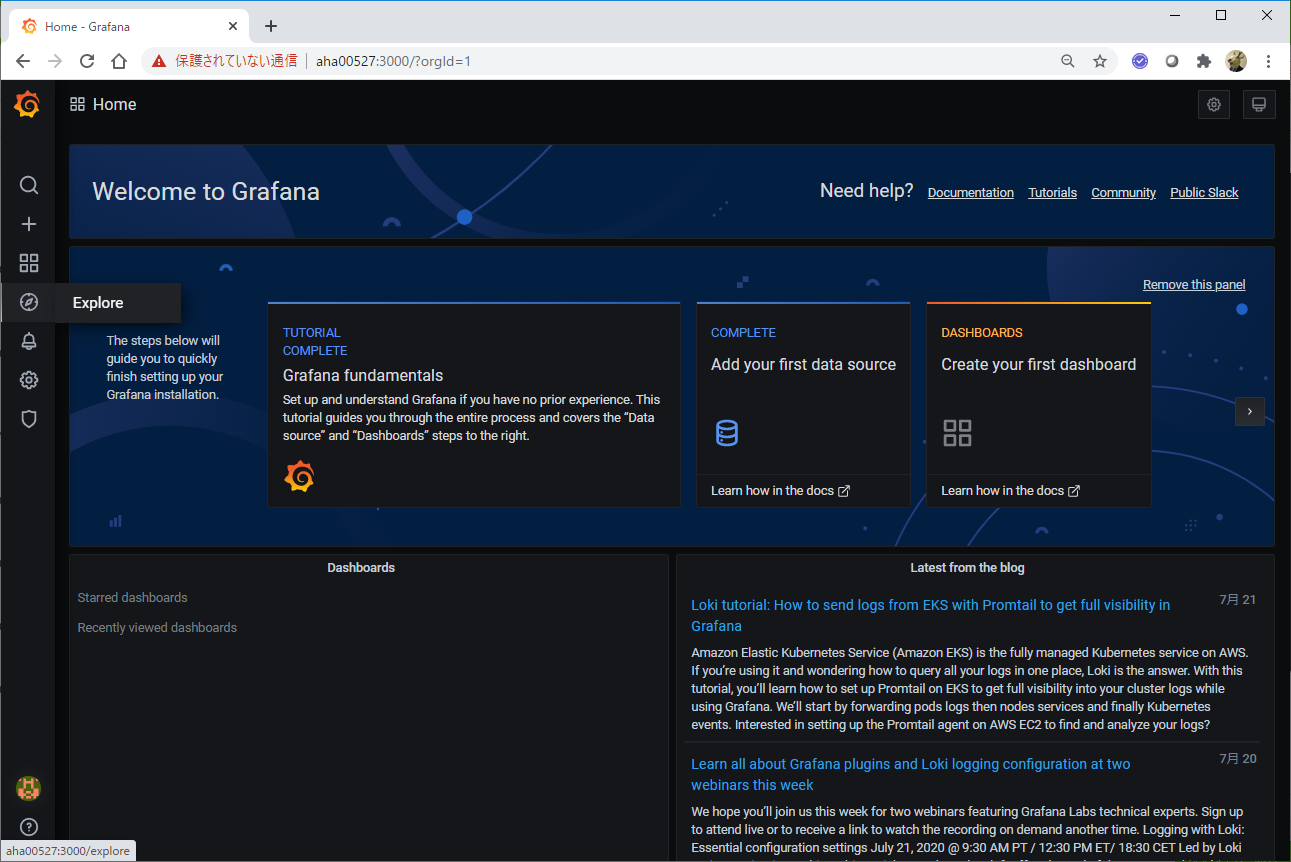
grafanaの画面にログインできました。
ElasticsearchのデータをGrafanaで扱うまでの基本操作
参考: Using Elasticsearch in Grafana
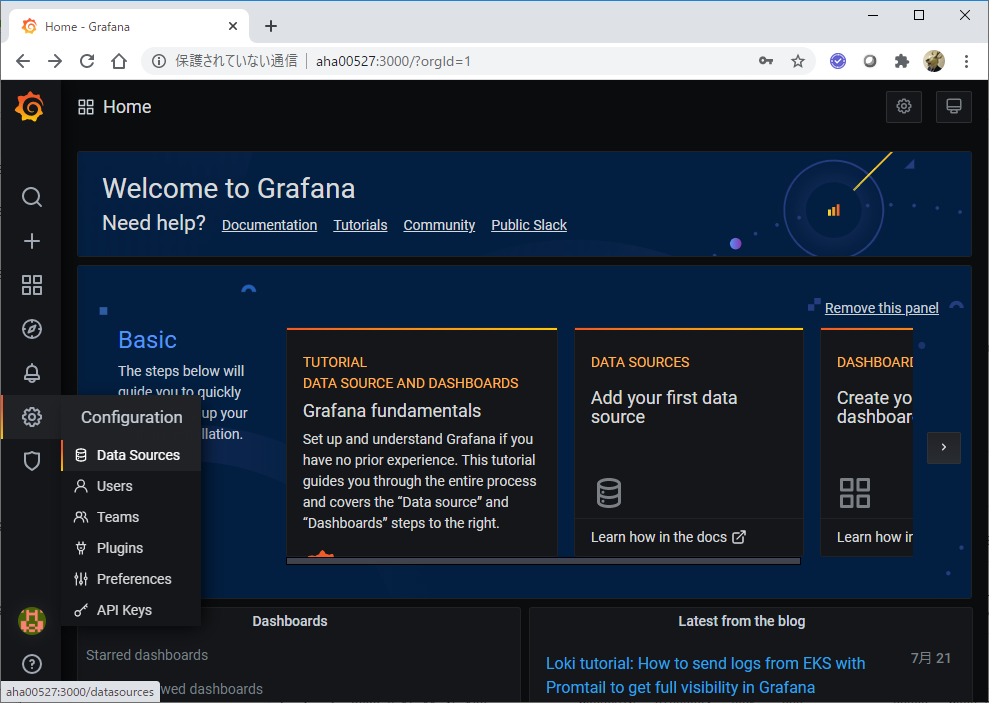
DataSourceの設定
Grafanaから参照したいindexパターンごとにDataSourceを定義します。
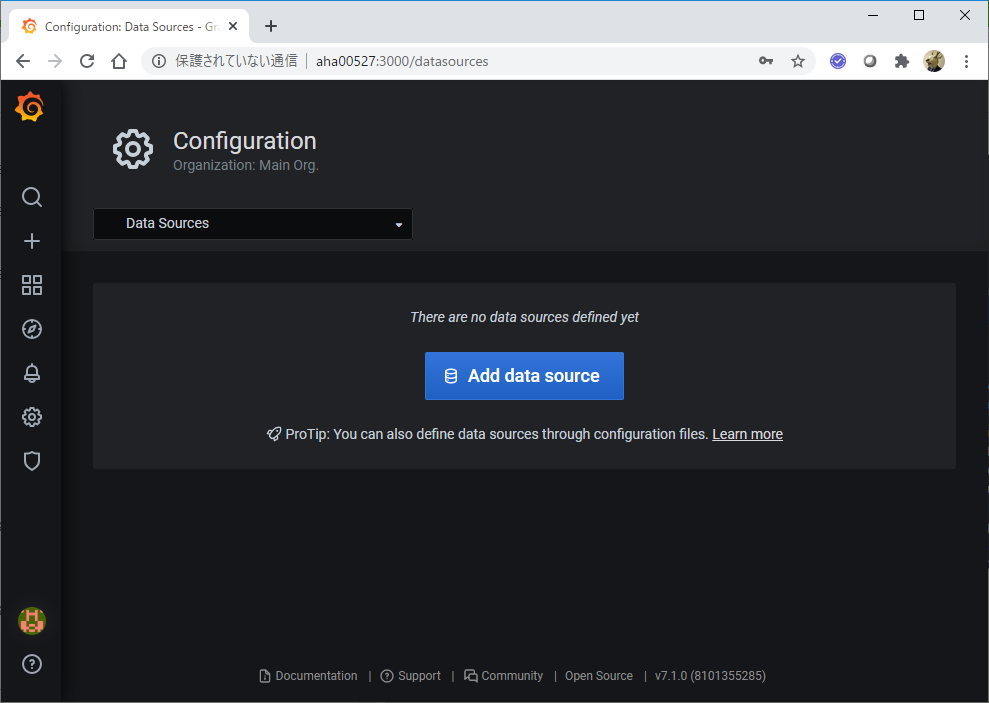
左側のメニューから Config - DataSourcesを選択
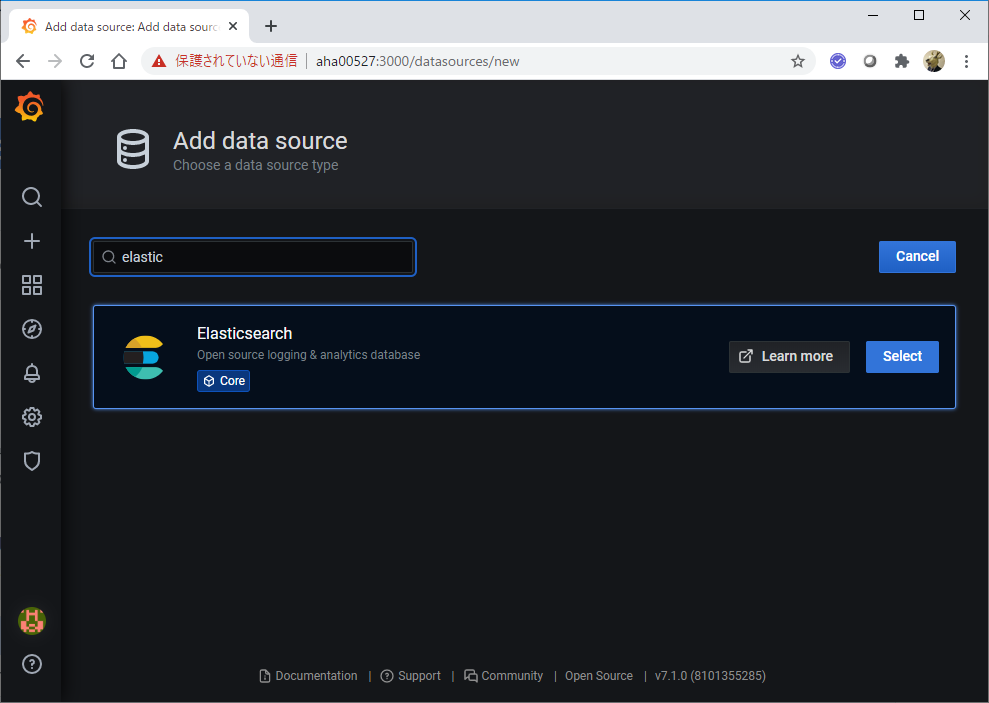
Add data sourceを選択
Elasticsearchを選択
ElasticsearchのURLやインデックスパターン等を指定します。
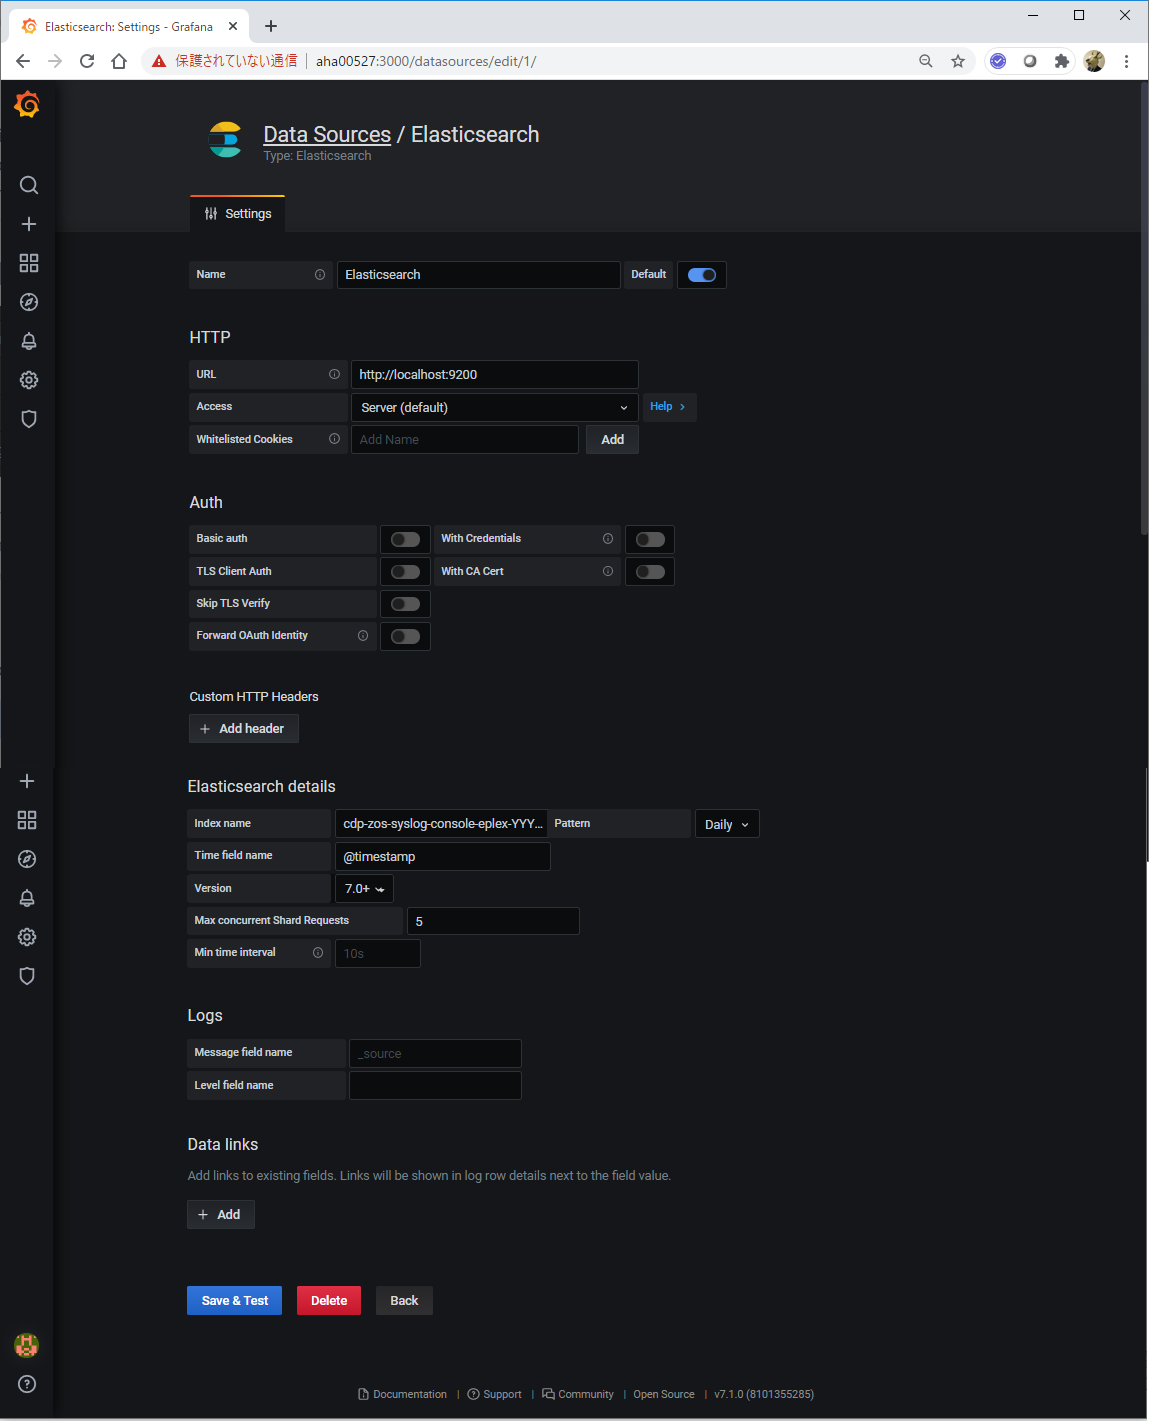
上で指定したElasticsearch上のインデックスをデータソースとしてGrafana上で取り扱うことができます。
Explorer
Exploreを試してみます。Kibanaでいう所のDiscoverに相当するものでしょうか。
左側のメニューからExplorerを選択
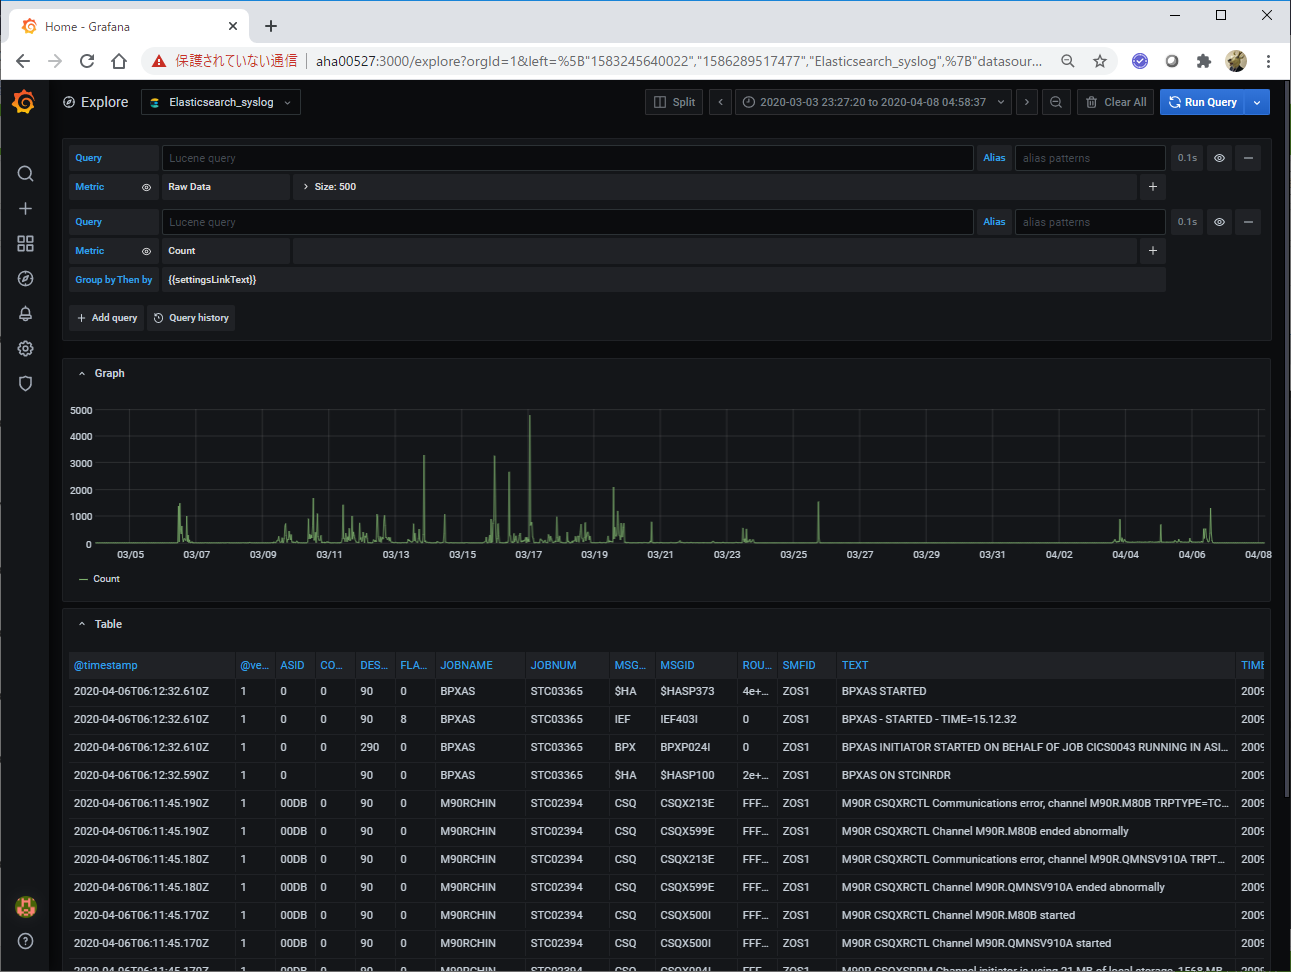
一応KibanaのDiscoverっぽい画面はここで出せるようですが、Kibanaほど柔軟に表示フィールドなどの制御はできなさそう。
Elasticsearch上のログをGrafanaのLogで参照
Visualizeの種類でLogsというものがあるようなので試してみます。(BETAとなっていますが...)
参考:
Logs (BETA)
LogLevel enum
サンプルデータの準備
Logsでは、ログレベルに合わせて各ログを色分けして表示してくれるようです。
サンプルデータとして以下のようなデータを用意しElasticsearchに取り込んでおきます。
{"message":"hello world - critical", "loglevel":"critical", "field01":"LOGTEST", "field02":"AAA", "field_date":"2020-07-22", "field_time":"11:11:11.111"}
{"message":"hello world - debug", "loglevel":"debug", "field01":"LOGTEST", "field02":"AAA", "field_date":"2020-07-22", "field_time":"11:11:12.111"}
{"message":"hello world - error", "loglevel":"error", "field01":"LOGTEST", "field02":"AAA", "field_date":"2020-07-22", "field_time":"11:11:13.111"}
{"message":"hello world - info", "loglevel":"info", "field01":"LOGTEST", "field02":"AAA", "field_date":"2020-07-22", "field_time":"11:11:14.111"}
{"message":"hello world - trace", "loglevel":"trace", "field01":"LOGTEST", "field02":"AAA", "field_date":"2020-07-22", "field_time":"11:11:15.111"}
{"message":"hello world - unknown", "loglevel":"unknown", "field01":"LOGTEST", "field02":"AAA", "field_date":"2020-07-22", "field_time":"11:11:16.111"}
{"message":"hello world - warning", "loglevel":"warning", "field01":"LOGTEST", "field02":"AAA", "field_date":"2020-07-22", "field_time":"11:11:17.111"}

{"message":"hello world - aaaaa", "loglevel":"critical", "field01":"LOGTEST", "field02":"AAA", "field_date":"2020-07-22", "field_time":"11:11:21.111"}
{"message":"hello world - bbbbb", "loglevel":"debug", "field01":"LOGTEST", "field02":"AAA", "field_date":"2020-07-22", "field_time":"11:11:22.111"}
{"message":"hello world - ccccc", "loglevel":"error", "field01":"LOGTEST", "field02":"AAA", "field_date":"2020-07-22", "field_time":"11:11:23.111"}
{"message":"hello world - ddddd", "loglevel":"info", "field01":"LOGTEST", "field02":"AAA", "field_date":"2020-07-22", "field_time":"11:11:24.111"}
{"message":"hello world - eeeee", "loglevel":"trace", "field01":"LOGTEST", "field02":"AAA", "field_date":"2020-07-22", "field_time":"11:11:25.111"}
{"message":"hello world - fffff", "loglevel":"unknown", "field01":"LOGTEST", "field02":"AAA", "field_date":"2020-07-22", "field_time":"11:11:26.111"}
{"message":"hello world - ggggg", "loglevel":"warning", "field01":"LOGTEST", "field02":"AAA", "field_date":"2020-07-22", "field_time":"11:11:27.111"}

{"message":"hello world - without loglevel / critical", "loglevel":"", "field01":"LOGTEST", "field02":"AAA", "field_date":"2020-07-22", "field_time":"11:11:31.111"}
{"message":"hello world - without loglevel / debug", "loglevel":"", "field01":"LOGTEST", "field02":"AAA", "field_date":"2020-07-22", "field_time":"11:11:32.111"}
{"message":"hello world - without loglevel / error", "loglevel":"", "field01":"LOGTEST", "field02":"AAA", "field_date":"2020-07-22", "field_time":"11:11:33.111"}
{"message":"hello world - without loglevel / info", "loglevel":"", "field01":"LOGTEST", "field02":"AAA", "field_date":"2020-07-22", "field_time":"11:11:34.111"}
{"message":"hello world - without loglevel / trace", "loglevel":"", "field01":"LOGTEST", "field02":"AAA", "field_date":"2020-07-22", "field_time":"11:11:35.111"}
{"message":"hello world - without loglevel / unknown", "loglevel":"", "field01":"LOGTEST", "field02":"AAA", "field_date":"2020-07-22", "field_time":"11:11:36.111"}
{"message":"hello world - without loglevel / warning", "loglevel":"", "field01":"LOGTEST", "field02":"AAA", "field_date":"2020-07-22", "field_time":"11:11:37.111"}

{"message":"hello world - without loglevel / critical debug error", "loglevel":"", "field01":"LOGTEST", "field02":"AAA", "field_date":"2020-07-22", "field_time":"11:11:41.111"}
{"message":"hello world - without loglevel / debug error info", "loglevel":"", "field01":"LOGTEST", "field02":"AAA", "field_date":"2020-07-22", "field_time":"11:11:42.111"}
{"message":"hello world - without loglevel / error info trace", "loglevel":"", "field01":"LOGTEST", "field02":"AAA", "field_date":"2020-07-22", "field_time":"11:11:43.111"}
{"message":"hello world - without loglevel / info trace unknown", "loglevel":"", "field01":"LOGTEST", "field02":"AAA", "field_date":"2020-07-22", "field_time":"11:11:44.111"}
{"message":"hello world - without loglevel / trace unknown warning", "loglevel":"", "field01":"LOGTEST", "field02":"AAA", "field_date":"2020-07-22", "field_time":"11:11:45.111"}
{"message":"hello world - without loglevel / unknown warning critical", "loglevel":"", "field01":"LOGTEST", "field02":"AAA", "field_date":"2020-07-22", "field_time":"11:11:46.111"}
{"message":"hello world - without loglevel / warning critial debug", "loglevel":"", "field01":"LOGTEST", "field02":"AAA", "field_date":"2020-07-22", "field_time":"11:11:47.111"}

{"message":"hello world -  critical debug error", "loglevel":"aaa", "field01":"LOGTEST", "field02":"AAA", "field_date":"2020-07-22", "field_time":"11:11:51.111"}
{"message":"hello world -  debug error info", "loglevel":"bbb", "field01":"LOGTEST", "field02":"AAA", "field_date":"2020-07-22", "field_time":"11:11:52.111"}
{"message":"hello world -  error info trace", "loglevel":"ccc", "field01":"LOGTEST", "field02":"AAA", "field_date":"2020-07-22", "field_time":"11:11:53.111"}
{"message":"hello world -  info trace unknown", "loglevel":"ddd", "field01":"LOGTEST", "field02":"AAA", "field_date":"2020-07-22", "field_time":"11:11:54.111"}
{"message":"hello world -  trace unknown warning", "loglevel":"eee", "field01":"LOGTEST", "field02":"AAA", "field_date":"2020-07-22", "field_time":"11:11:55.111"}
{"message":"hello world -  unknown warning critical", "loglevel":"fff", "field01":"LOGTEST", "field02":"AAA", "field_date":"2020-07-22", "field_time":"11:11:56.111"}
{"message":"hello world -  warning critial debug", "loglevel":"ggg", "field01":"LOGTEST", "field02":"AAA", "field_date":"2020-07-22", "field_time":"11:11:57.111"}
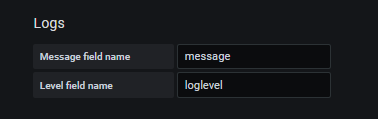
DataSourceの定義
GrafanaのDataSourceの定義で、Logsの項目で以下のようにMessage用のフィールドと、Level用のフィールドを指定します。
Explorer
Explorer画面で上で作成したDataSourceを選択し、MetricとしてLogsを指定します。
すると以下のようにログを参照することができます。
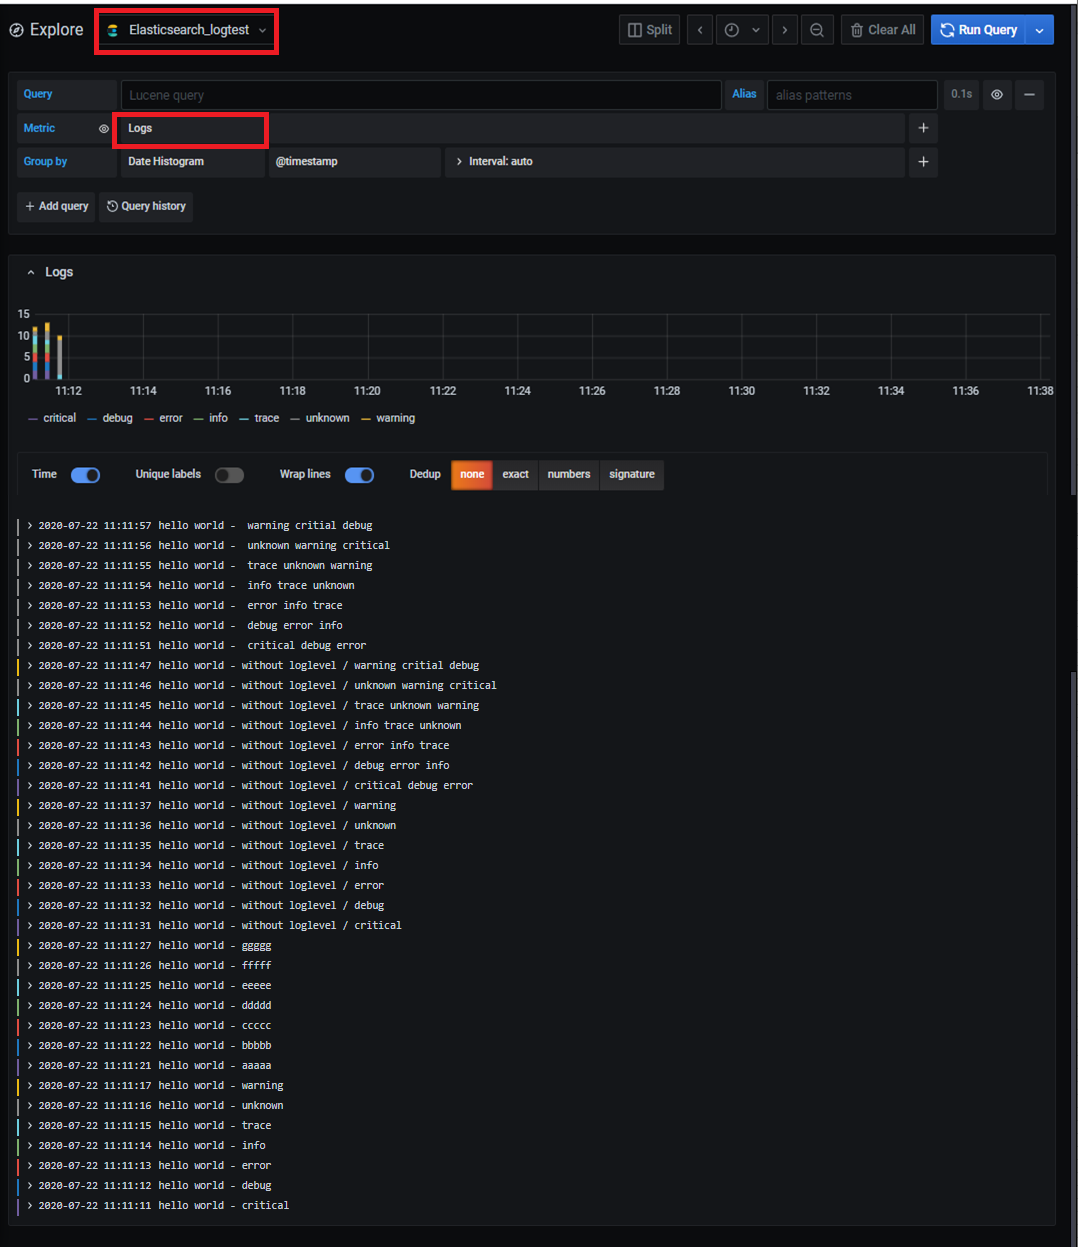
LogLevel用のフィールドの内容に応じて色分けしてくれます。LogLevelに値が無い場合はMessage用のフィールドに含まれる文字列から判断してくれるっぽい。Messageの文字列をみて最初に現れた"critical, debug, error, info trace, unknown, warning"のいずれかのキーワードが適用されるようです(複数マッチする場合は最初のキーワードが適用されているように見えます)。
LogLevelに関係ない文字列("aaa","bbb"など)を入れるとMessage用のフィールドに関係無くunknown扱いになるようです。
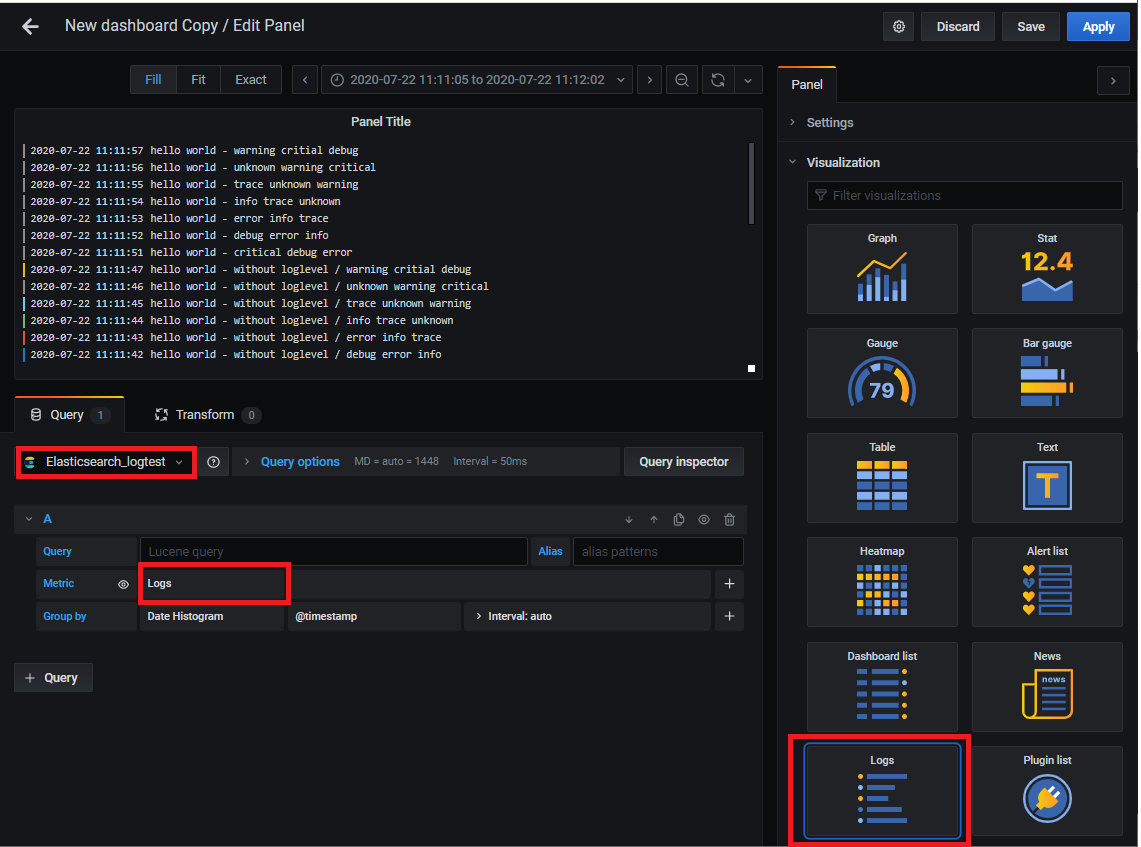
Dashboard
Dashboardのパネルでも同様にログを表示させることができます。
VisualizeでLogsを選択し、上で作成したDataSource、MetricにLogsを指定します。
おわりに
ログレベルによって色分けされて表示さえるのは分かりやすいですが、使い勝手としてはKibanaのDiscoverの方が良いような気がします。複雑な検索とか細かな制御が必要無いのであれば充分だと思いますが。