1. Motivation
Using the following Kaggle purchase data to do targeting and decile analysis.
https://www.kaggle.com/vijayuv/onlineretail
2. Procedures
- Read retail_data and perform preprocessing
- Calculate the sum of
TotalPricefor eachCustomerID - Sort the dataframe in descending order based on the
TotalPriceperCustomerID. - Divide the customers into n
groups (where𝑛is a natural number that does not exceed the number of data and does not have the same value in the quartile). - Calculate what percentage of sales the each group's
TotalPriceaccounts for. (decile analysis) - Sort the groups by their calculated percentages in descending order.
- Summarize the above steps as a function.
- Create a cumulative distribution plot to visualize the contribution of each group to the total TotalPrice.
3. Steps
3-1. Read retail_data and perform preprocessing
Code
#Load the libraries
import pandas as pd
import numpy as np

# Data loading and preprocessing *Takes a lot of time
file_url = "http://archive.ics.uci.edu/ml/machine-learning-databases/00352/Online%20Retail.xlsx"
Excel_data = pd.ExcelFile(file_url)
retale_data = Excel_data.parse('Online Retail')

# Convert InvoiceNo to string type
retail_data['cancel_flg'] = retail_data.InvoiceNo.map(lambda x:str(x)[0])

# Target invoices whose InvoiceNo starts with 5 and whose ID is not Null
retail_data_1 = retail_data[(retail_data.cancel_flg == '5') & (retail_data.CustomerID.notnull())]

# Prepare main dataframe
df = retail_data_1.assign(TotalPrice=retail_data_1.Quantity * retail_data_1.UnitPrice)
Result
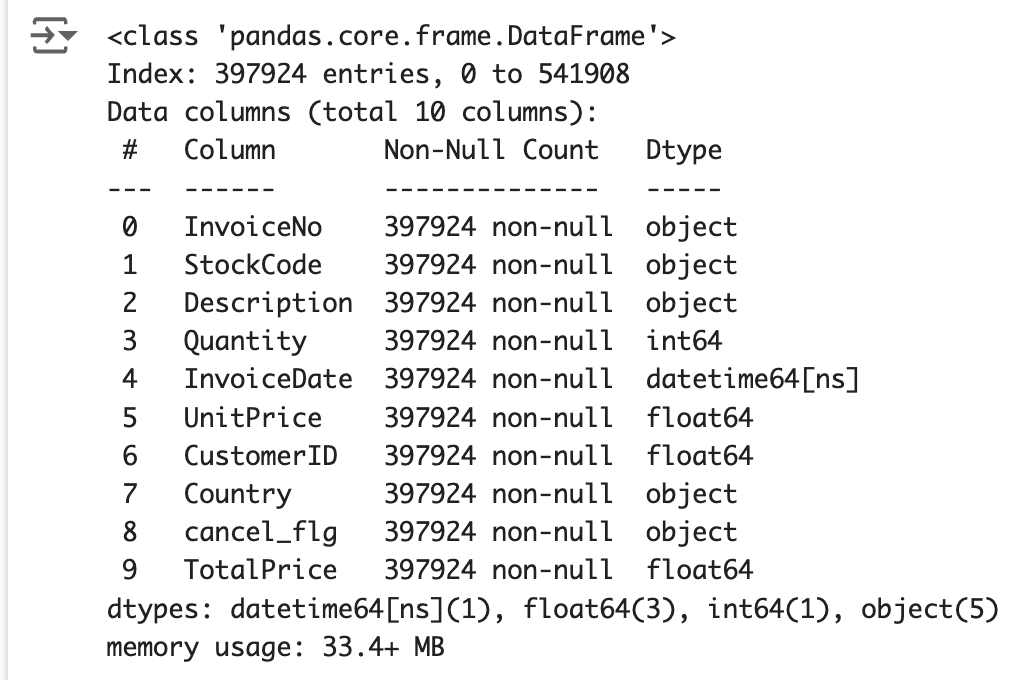
df.info()
df.describe()
3-2. Calculate the sum of TotalPrice for each CustomerID
sum = df.groupby('CustomerID')[['TotalPrice']].sum()
sum_sorted = sum.sort_values(by='TotalPrice', ascending=False)
Result
sum
3-3. Sort the dataframe in descending order based on the TotalPrice per CustomerID.
sum_sorted = sum.sort_values(by='TotalPrice', ascending=False)
Result
sum_sorted
3-4. Divide the customers into n groups .
where 𝑛 is a natural number that does not exceed the number of data and does not have the same value in the quartile
n = 10
group_labels = []
for i in range(n):
    group_labels.append('{0}th'.format(i+1))
sum_sorted['group'] = pd.qcut(sum_sorted['TotalPrice'], n, labels=group_labels, duplicates='drop')
Result
sum_sorted
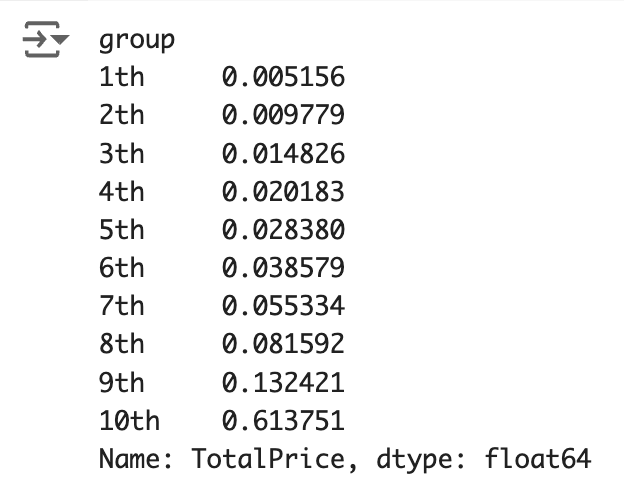
3-5. Calculate what percentage of sales the each group's TotalPrice accounts for. (decile analysis)
# Find what percentage of the total purchase price each group represents
proportions = sum_sorted.groupby('group')['TotalPrice'].sum() / sum_sorted['TotalPrice'].sum()
Result
proportions
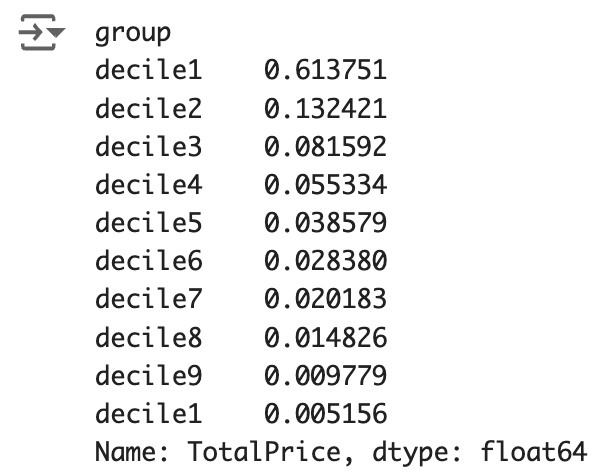
3-6. Sort the groups by their calculated percentages in descending order.
# Sort in ascending order by proportion height
result = proportions.sort_values(ascending=False)
Result
result
# Rank groups by percentage height and reassign indexes by rank
result.index = result.sort_values().index.map(lambda x: 'decile'+str(x)[0])
Result
result
3-7. Summarize the above steps as a function.
def function(df, n):
    sum = df.groupby('CustomerID')[['TotalPrice']].sum()
    sum_sorted = sum.sort_values(by='TotalPrice', ascending=False)
    group_labels = []
    for i in range(n):
        group_labels.append('{0}th'.format(i+1))
    sum_sorted['group'] = pd.qcut(sum_sorted['TotalPrice'], n, labels=group_labels, duplicates='drop')
    proportions = sum_sorted.groupby('group')['TotalPrice'].sum() / sum_sorted['TotalPrice'].sum()
    result = proportions.sort_values(ascending=False)
    result.index = result.sort_values().index.map(lambda x: str(x)[0])
    return result
Result
function(df, 10)
3-8. Create a cumulative distribution plot to visualize the contribution of each group to the total TotalPrice.
# Visualize with Matplotlib
import matplotlib.pyplot as plt
N = 10
data = function(df, N)

fig, ax1 = plt.subplots(figsize=(6,4))

# Number of segments determines the abscissa
data_num = len(data)

# Cumulative sum
cum_per = np.cum(data)

# Bar chart
ax1.bar(range(data_num), data)
ax1.set_xticks(range(data_num))

# line graph
ax2 = ax1.twinx()
ax2.plot(range(data_num), cum_per, c="k", marker="o")
ax2.set_ylim([0, 1])
ax2.grid(True, which='both', axis='y')
Result
Result (where N=20)
Acknowledgement
Dua, D. and Graff, C. (2019). UCI Machine Learning Repository [http://archive.ics.uci.edu/ml]. Irvine, CA: University of California, School of Information and Computer Science.
Daqing Chen, Sai Liang Sain, and Kun Guo, Data mining for the online retail industry: A case study of RFM model-based customer segmentation using data mining, Journal of Database Marketing and Customer Strategy Management, Vol. 19, No. 3, pp. 197–208, 2012 (Published online before print: 27 August 2012. doi: 10.1057/dbm.2012.17).


