[初投稿]
自分の勉強したことを振り返ることがメインの目的です。拙い文章かもしれませんが、よろしくお願いします!
概要
n個のサイコロを振った時の和の確率分布を、pythonを使った統計的確率で求める。
はじめに
確率分布とは、ある操作において起こりうる事象のそれぞれの確率の分布を表現したもので、一般には散布図やヒストグラム形式で表されます。
今回はn個ののサイコロを振るという操作を十分大きな試行回数行うことで、確率を求めていきます。
これは統計的確率、もっとわかりやすくいうと、経験に基づいた確率ですね。
試行回数が多ければ多いほどより正確な確率が求められます。
実装コード
実装は、https://note.com/omori55/n/n639148bab42b
を参考(ほぼパクリ)させていただきましたが、使ったライブラリや関数の中身について自分なりに噛み砕いたことを書きます。
import random
import matplotlib.pyplot as plt
n = int(input("幾つのサイコロを振る?"))
m= 500000 # 今回の試行回数
dice=[] # 各和になった回数を格納するリスト

for i in range(5*n+1): # リストdiceを0で初期化
    dice.append(0)

for i in range(m): # 和を求めるという試行をm回繰り返す
    sum =0 # 和を格納する変数
    for j in range(n): # 和を求める
        sum = sum + random.randint(1,6) # 和を求める際にはn個のサイコロの出る目をrandint(1,6)でそれぞれランダムに決定し、加算する
    dice[sum-n] = dice[sum-n]+1

for i in range(5*n+1):  # 結果を出力
    print(i+n, (dice[i])/m)
    plt.bar(i+n, (dice[i])/m)
plt.show()
出力の際に使ったplt.barはmatplotlibライブラリの機能で、棒グラフを作ります。
matplotlib.pyplot.bar(left,height)
leftは各棒の横軸、heightは各棒の縦軸データです。
出力結果
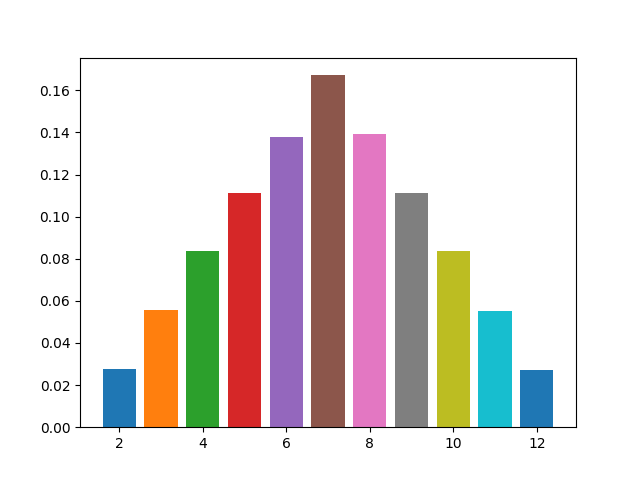
今回はn=2としたときの結果です
2 0.027638
3 0.05571
4 0.083218
5 0.111662
6 0.13886
7 0.166864
8 0.14033
9 0.110106
10 0.08325
11 0.055388
12 0.026974
n = 2 の場合は,「三角分布」です。
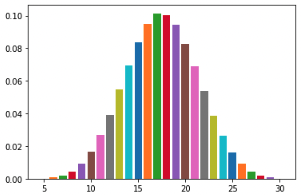
n = 3, 4, ...と増やしていくとだんだん正規分布に近づいていきます。以下は n = 5 の場合です。

