目的
通常の回帰では$y \sim \beta_0 + \sum\beta_i x_i$と書くときに、説明変数$\vec{x}$には誤差(測定誤差など)が乗らないという仮定をしているのは周知のとおりです。
一方、現実のデータは説明変数にも何らかの誤差が乗っていると考えたほうが自然な場合も多いため、その場合に何が起こるのかを理解するために実験をしてみました。
先に答えを言うと
ちなみにこの現象はRegression Dilution / Attenuationとして知られているらしく、結論から言うと回帰係数が過少推定されるそうです。
回帰による推定係数 = 真の回帰係数 \times \frac{真の説明変数の分散}{見かけの説明変数の分散}
https://www.bmj.com/content/340/bmj.c2289 より
なので、$\vec{x}$にどれだけの誤差が乗っているかを知っていれば、事後的に補正を掛けることも可能なようです
実験したこと
なのですが、本当にそうなるのか疑問に思ったので、実際に実験してみました。
手順としては、以下の通りです。
- $y \sim 2x+1$に従って適当なデータを発生
- $x_{obs} = x + \epsilon$とノイズを加えて、$y$を$x$と$x_{obs}$で回帰した結果を比べる
- StanとRでベイズ統計モデリングの7.7節でStanを使用した説明変数にノイズがある場合の回帰について言及されていたので、この方式で正しい回帰係数が得られるのかテスト
実験結果
まずは普通にscikitlearnで回帰した場合の回帰係数です。
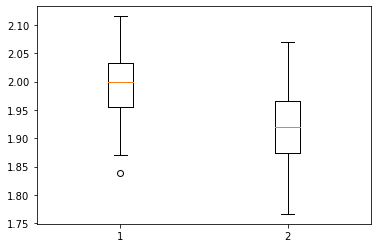
100回実験した結果の係数の分布を以下に示します。

このように、(当然ながら)$x$にノイズが乗らない場合の回帰係数は平均が2.0、ノイズありの場合は1.9強となりました。
\begin{align}
回帰による推定係数 &= 真の回帰係数 \times \frac{真の説明変数の分散}{見かけの説明変数の分散} \\
&=2.0 \times \frac{5^2}{5^2+1^2} \\
&= 1.92
\end{align}
と、先ほどの式で示した結果と一致します。
次に、stanで実験した結果を示します。
まず、コードは以下の通りです。
import pystan
# import numpy as np
# import matplotlib.pyplot as plt
%matplotlib inline

import arviz
import random
from sklearn.linear_model import LinearRegression
import pandas as pd
import numpy as np
import matplotlib.pyplot as plt

random.seed(123)

N = 100
a = 2.0
b = 1.0
sigma_x = 1.0
sigma_y = 3.0
x_range_mu = 0.0
x_range_sigma = 5.0
N_case = 100
a_est_list=[]
b_est_list=[]
a_est_list_noise=[]
b_est_list_noise=[]
a_est_list_stan=[]
b_est_list_stan=[]

regression_noise_code = """
data {
    int<lower=0> N;
    real y[N];
    real x_noise[N];
}
parameters {
    real<lower=0> sigma_y;
    real a_est;
    real b_est;
    real x[N];
}
model {
    for (i in 1:N){
        y[i] ~ normal(a_est * x[i] + b_est,sigma_y);
        x_noise[i] ~ normal(x[i],1.0);
    }

}
"""

for i in range(N_case):
    #Normal case
    x = [random.gauss(x_range_mu, x_range_sigma) for j in range(N)]
    y = [(a*x[j] + b + random.gauss(0, sigma_y)) for j in range(N)]
    data = pd.DataFrame(dict(x=x,y=y))
    lr = LinearRegression()
    lr.fit(data[["x"]],data[["y"]])
    a_est_list.append(lr.coef_[0][0])
    b_est_list.append(lr.intercept_[0])

    #Noise on x
    x_noise = [(x[j] + random.gauss(0, sigma_x)) for j in range(N)]
    data = pd.DataFrame(dict(x_noise=x_noise,y=y))
    lr = LinearRegression()
    lr.fit(data[["x_noise"]],data[["y"]])
    a_est_list_noise.append(lr.coef_[0][0])
    b_est_list_noise.append(lr.intercept_[0])

    #Stan
    regression_stan = pystan.StanModel(model_code=regression_noise_code)
    regression_dat = {'N':N, 'x_noise':x_noise, 'y':y}
    fit = regression_stan.sampling(data=regression_dat, iter=1000, chains=4)
    a_est_list_stan.append(fit["a_est"].mean())
    b_est_list_stan.append(fit["b_est"].mean())

plt.boxplot([a_est_list, a_est_list_noise, a_est_list_stan])
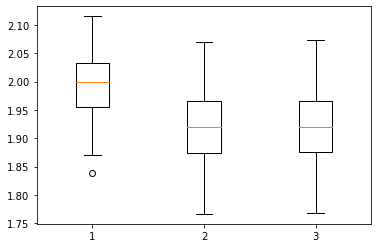
結果は、

あれ・・・?
ノイズ項を推定の中に取り入れているにも拘わらず、結果は普通に回帰した場合と大して変わらないものとなってしまいました。。
どうしてうまくいかなかったのか、追加で何かわかり次第追記します
まとめ
回帰の係数は複雑回帰怪奇