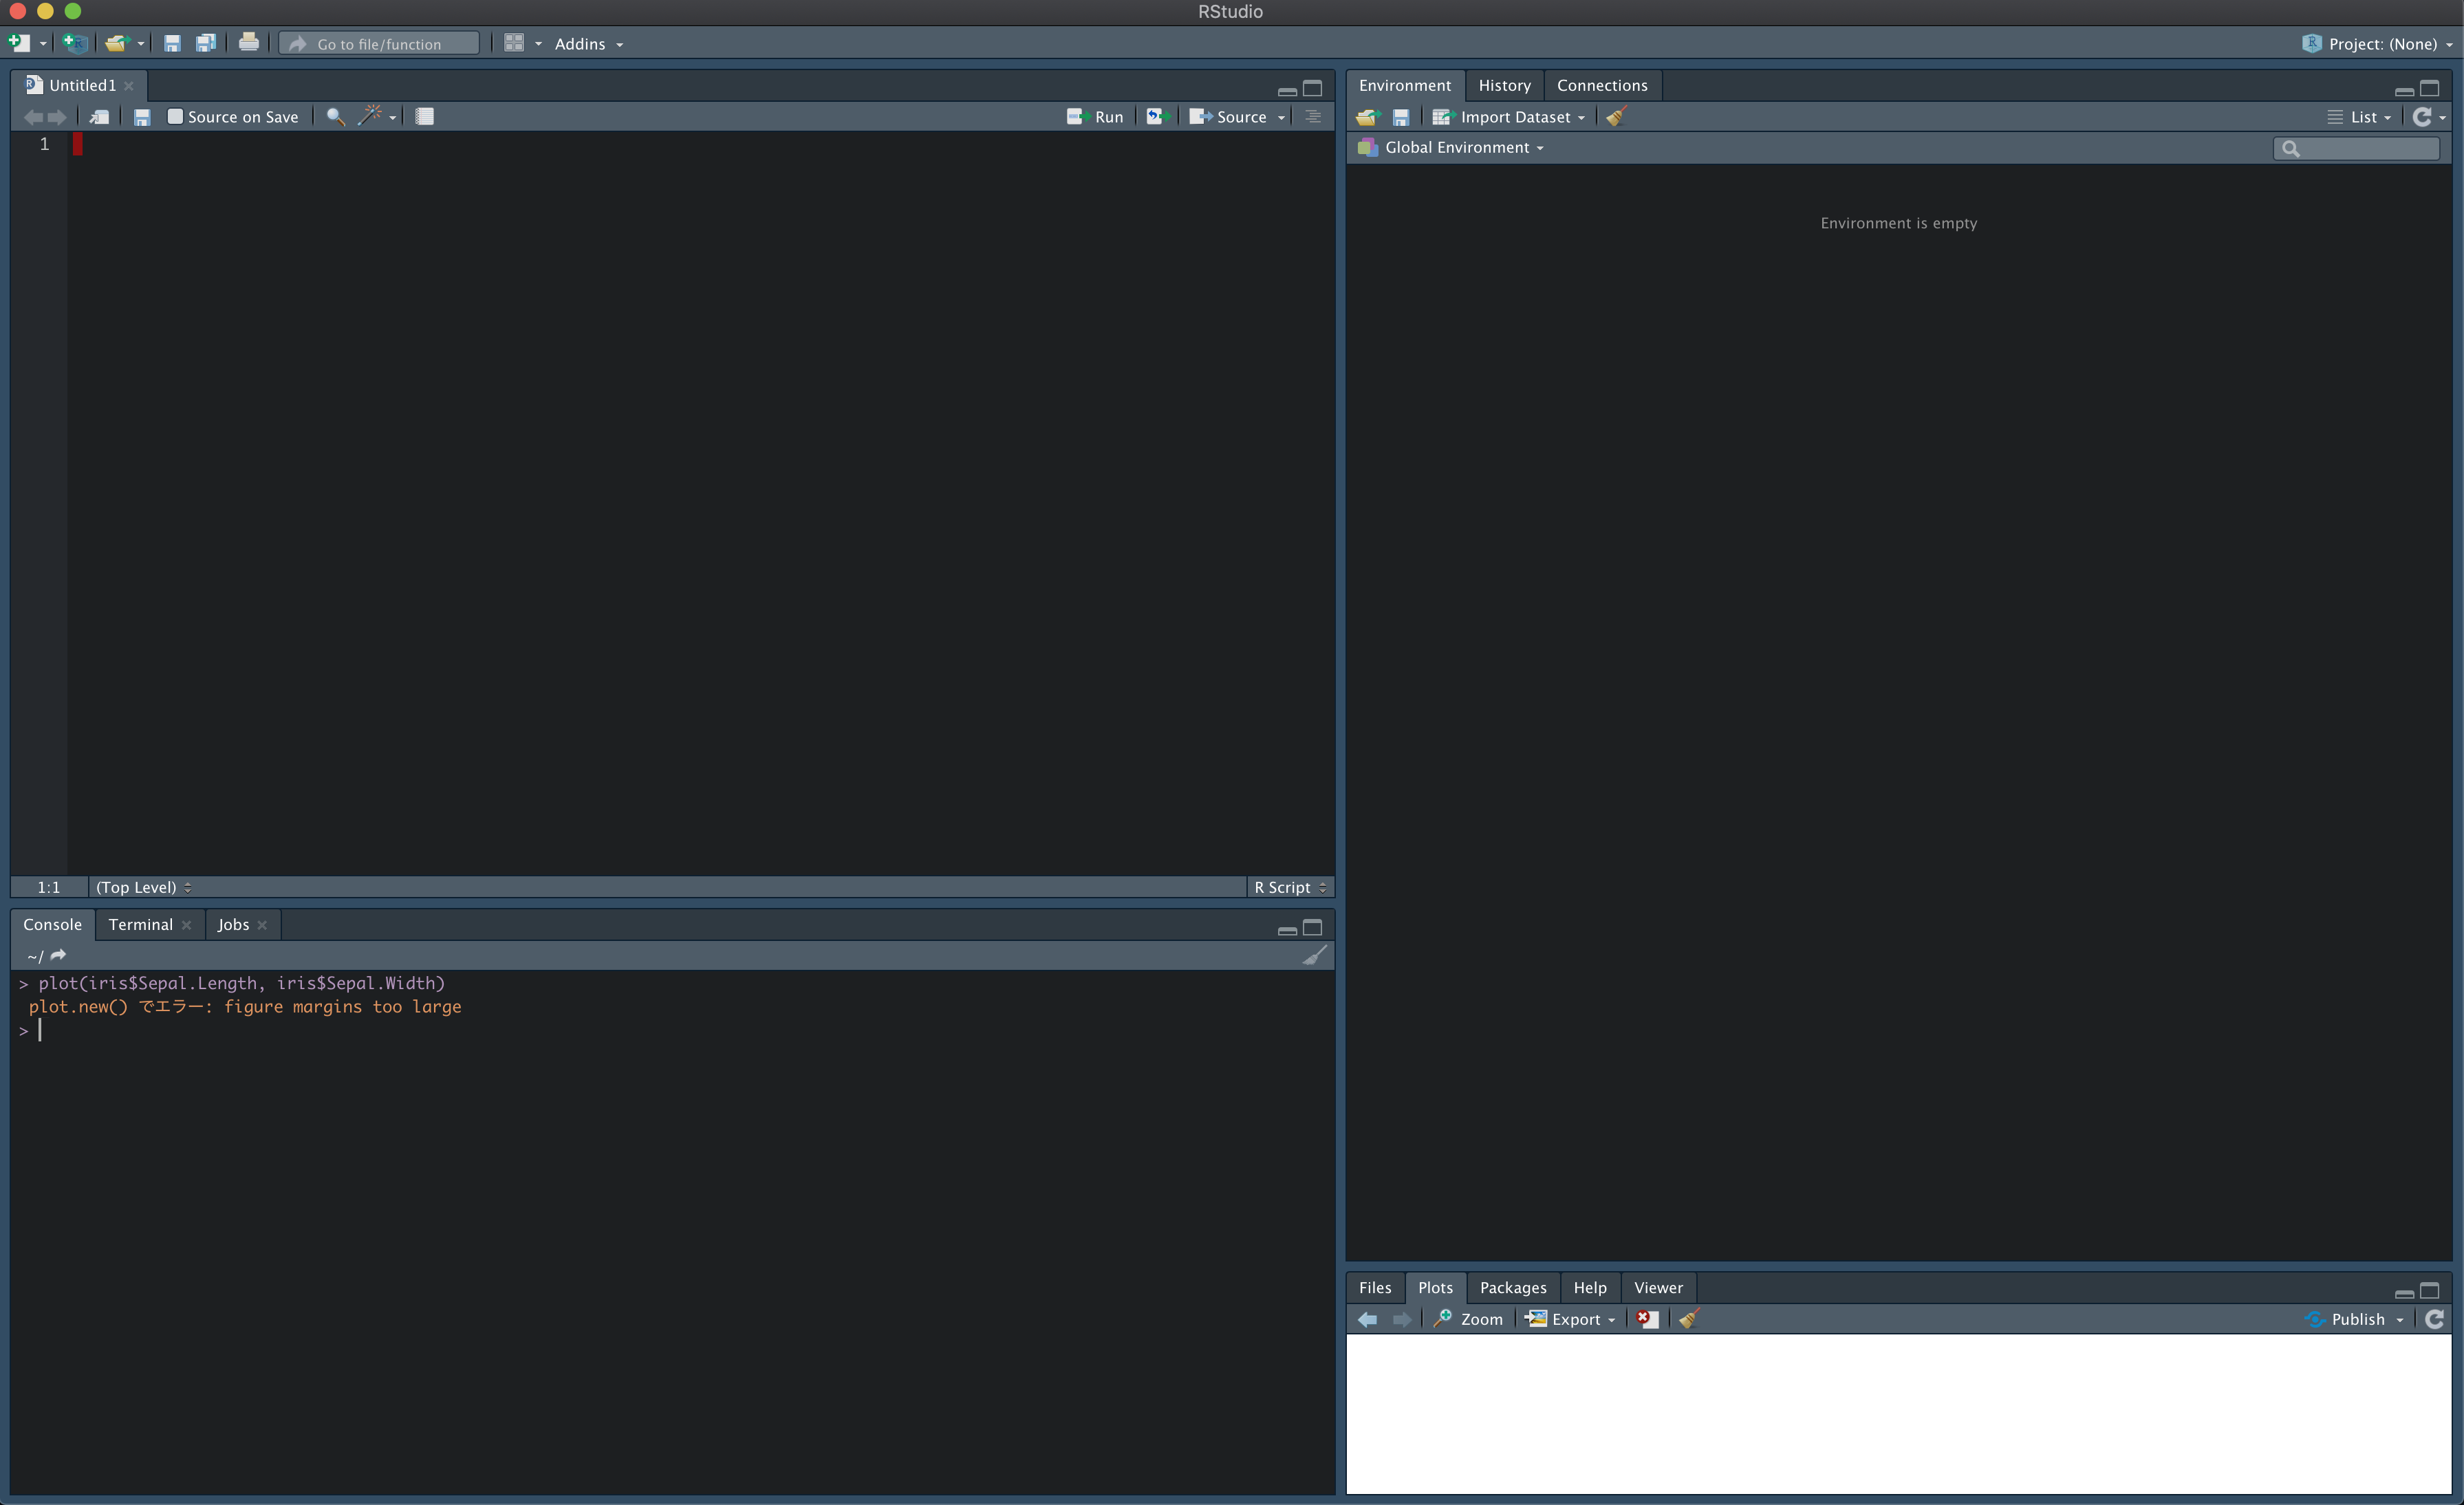
「figure margins too large」が発生する理由
描画したいグラフの大きさに対し、プロット領域が狭いときに出力されるエラー。
次のように、Plotsウィンドウが小さい場合にグラフを描こうとすると、plot.new() でエラー: figure margins too largeが発生して描画に失敗する。
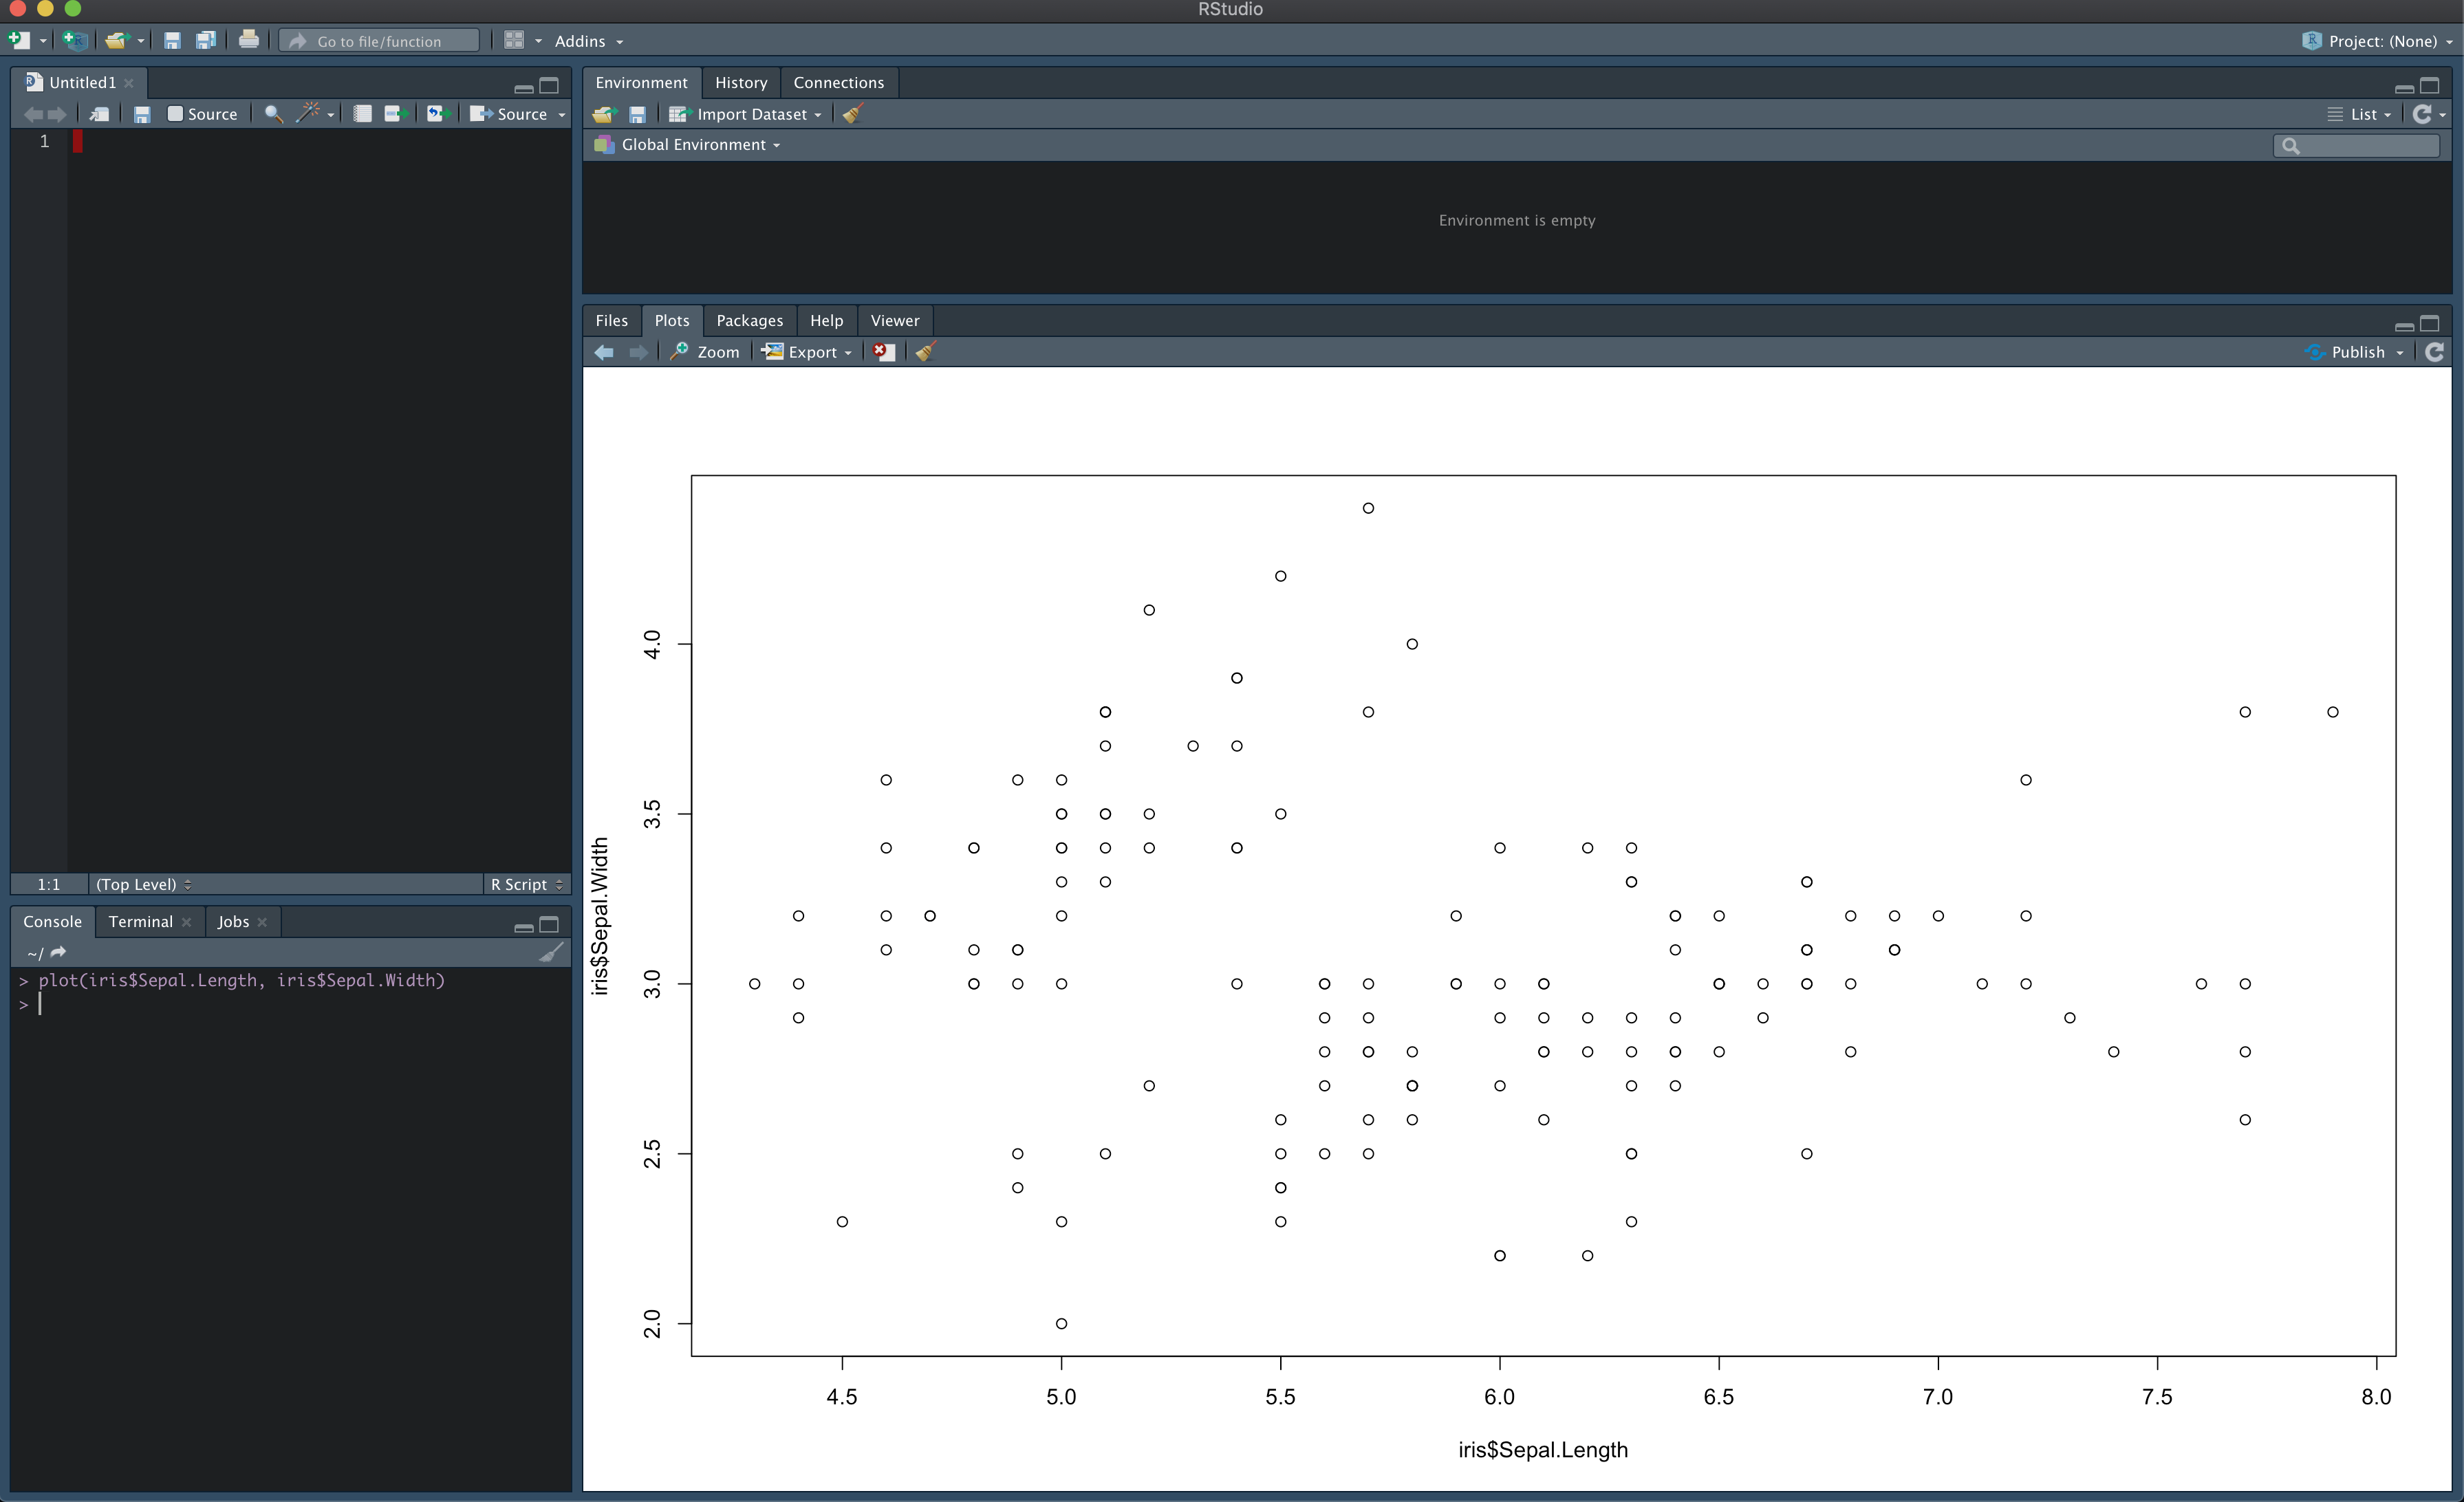
解決策1(まずはコレ)
Plotsウィンドウを大きくする。
解決策2
par("mar"=c(1,1,1,1))を呼び出して余白をなくす。
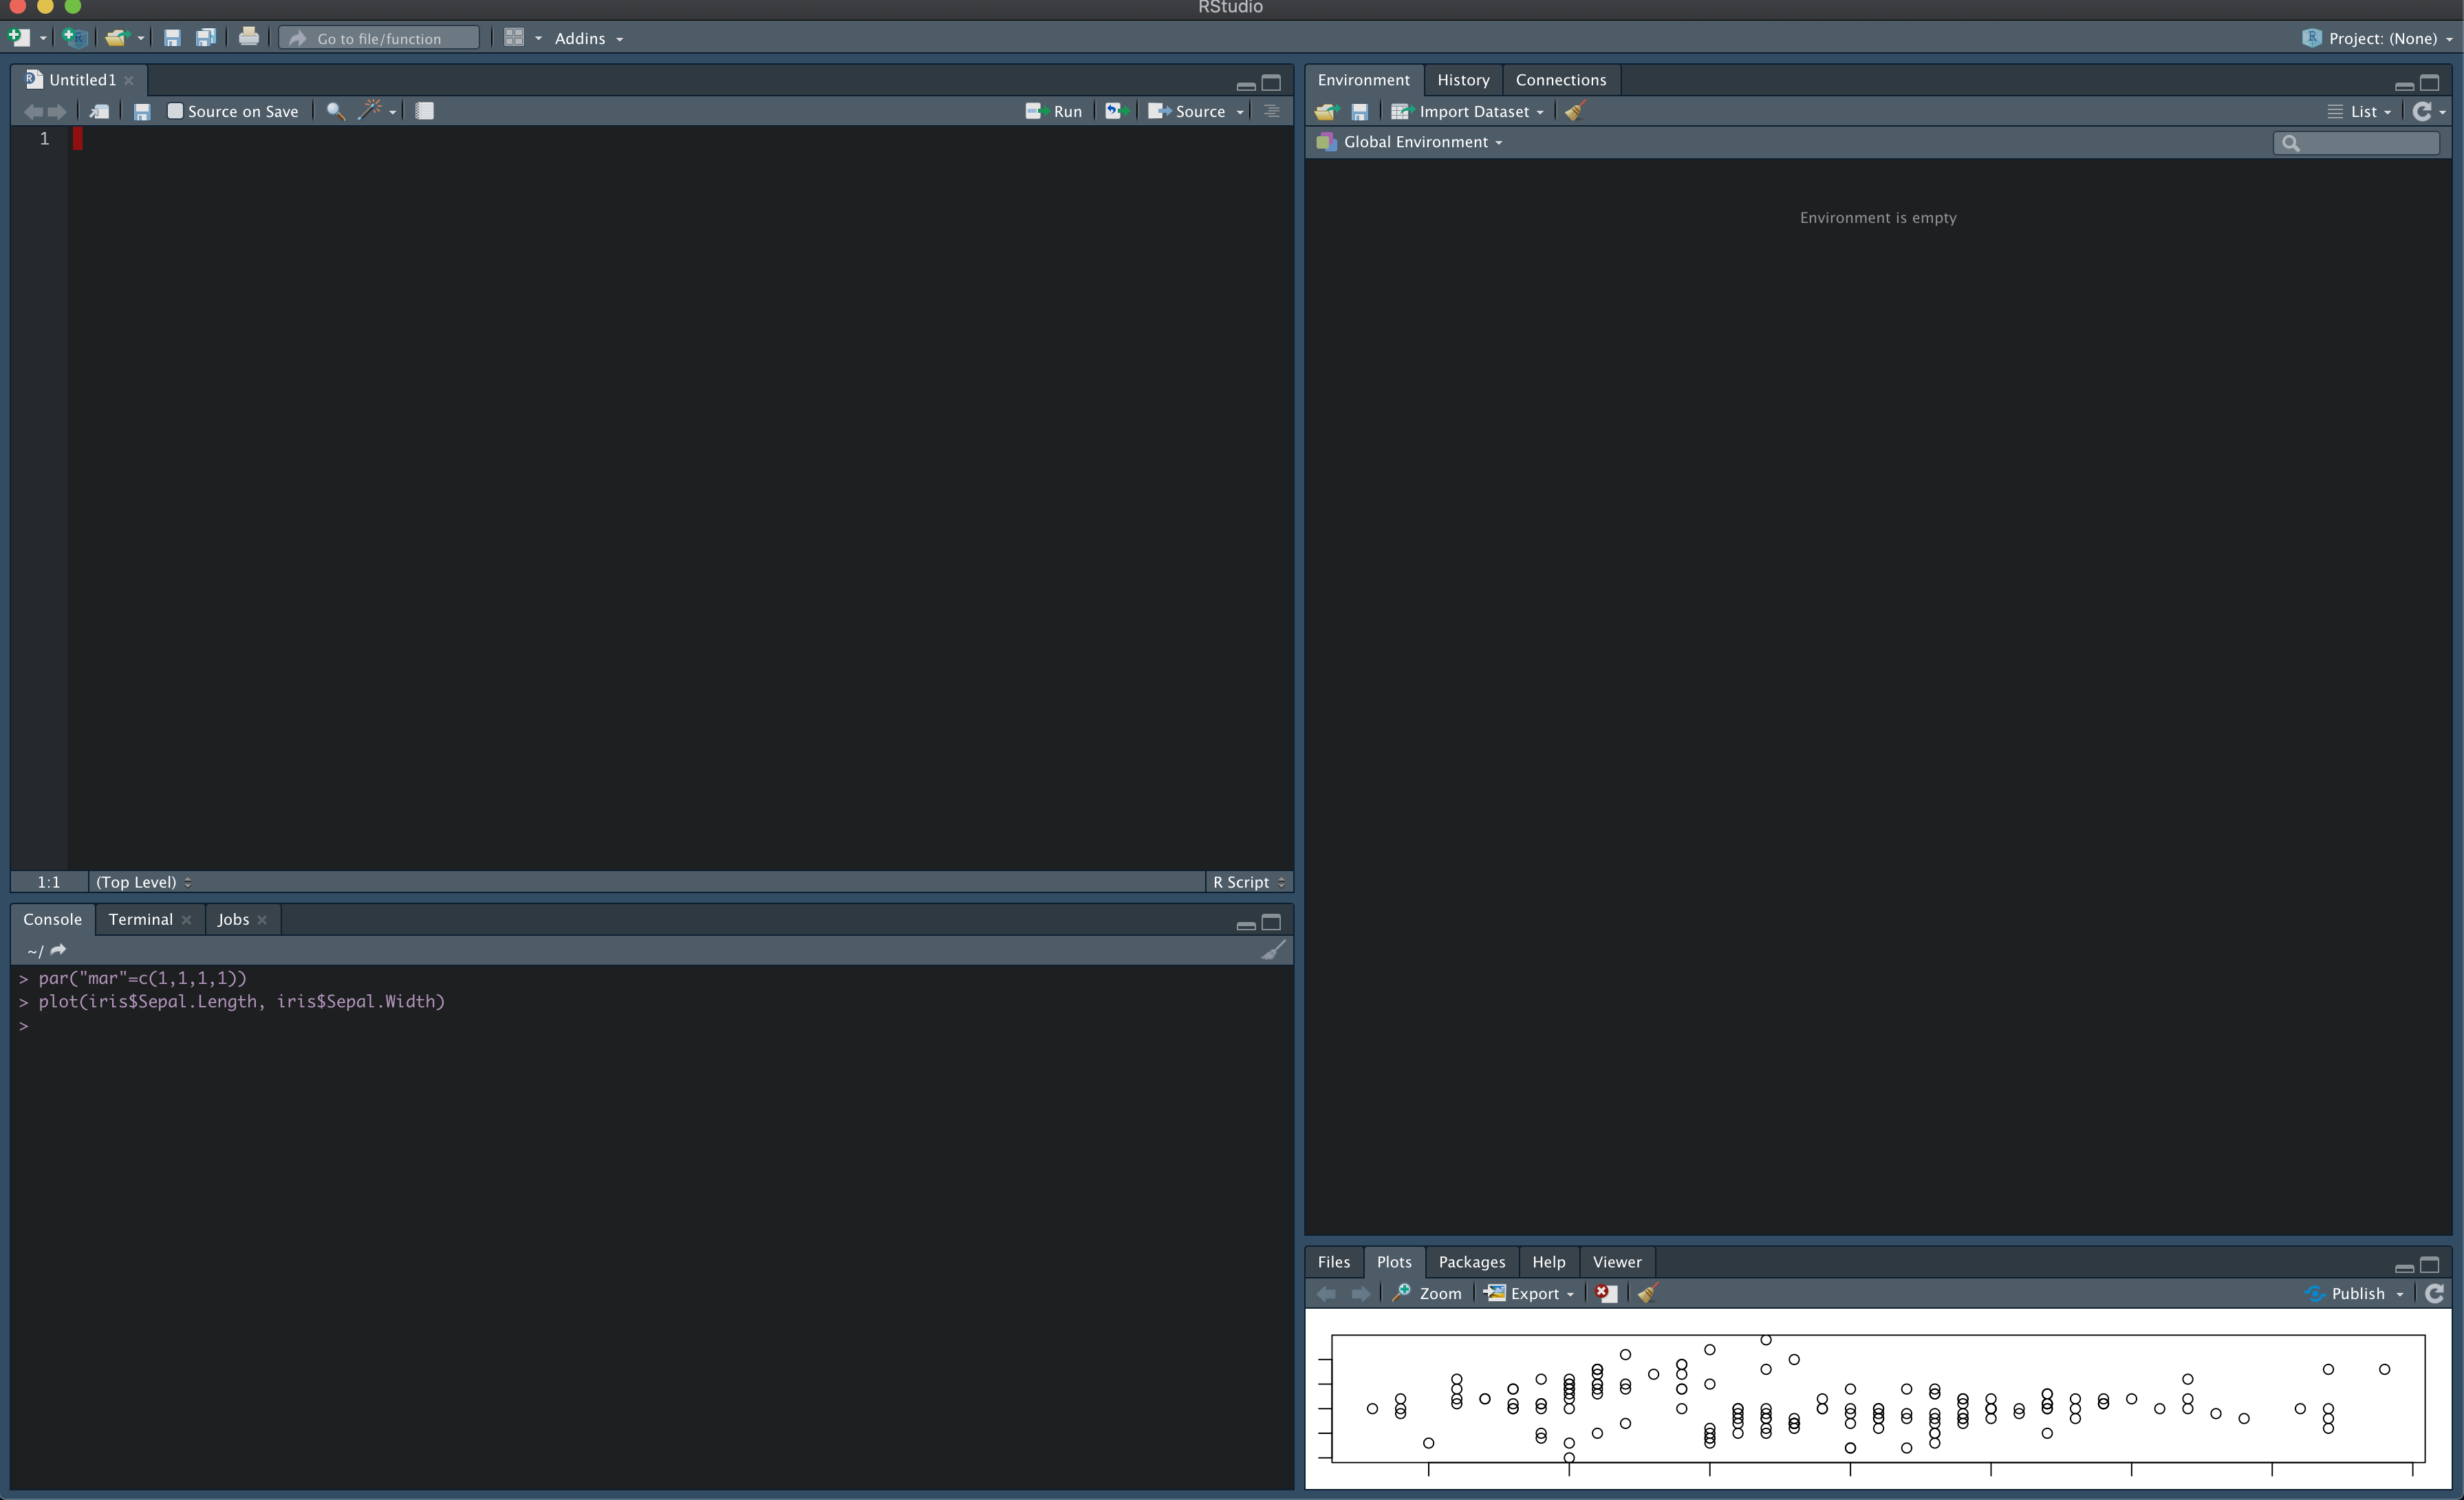
※ただし、この操作では、おそらく軸名やラベル名が消えてしまうとおもうので留意。
解決策3
次のコードで、描画用の別ウィンドウを立ち上げてプロット関数を実行する。
dev.new()
plot()

# 終了時は下記コードまたはウィンドウの「×」ボタンで閉じる
dev.off()

もしdev.new()を呼び出しても別ウィンドウが立ち上がらない場合は、もう一度dev.new()を呼び出すことで立ち上がるはず。
※1度目のdev.new()呼び出しで別ウィンドウが立ち上がらない理由は、まだPlotsウィンドウがアクティブでないときに、dev.new()を呼び出すとPlotsウィンドウをアクティブにするため。
解決策4(上記でダメな場合)
解決策1、2、3のあわせ技。
描画用の別ウィンドウを作り、余白をなくし、ウィンドウサイズを大きくした上で描画する。
dev.new()
par("mar"=c(1,1,1,1))

# ここでウィンドウのサイズを手動で大きくする。

plot()

# 終了時は下記コードまたはウィンドウの「×」ボタンで閉じる
dev.off()

以上です。