目次へのリンク
概要
MATLABで静止画の画像処理を行うワークフローについてご紹介します。
画像の読み込み、解析、可視化、書き出しまでを少ないコードで実現できます。
画像処理・解析のワークフローを身に着けて活用しましょう。
対応ファイル
初期化
変数などをクリアします。
clear;clc;close all;imtool close all
静止画の読み込み
静止画像の読込みます。
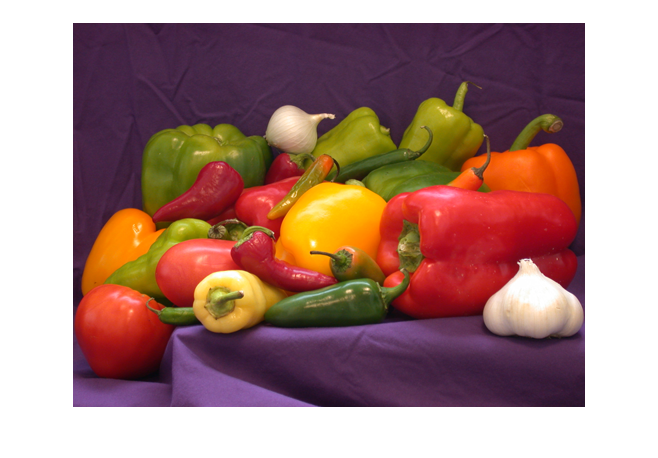
A=imread('peppers.png');
%
% ここに各種画像処理・解析 のコードを挿入 −−−−−−−−−
%
静止画の可視化
figure;
imshow(A);
解析結果の挿入
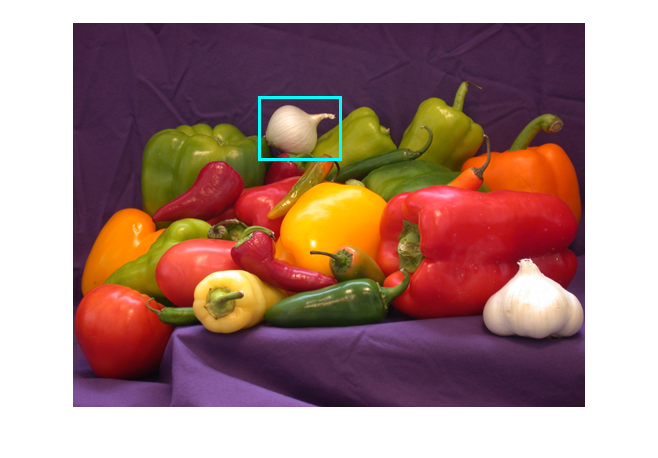
例として玉ねぎを四角で囲んでみます。簡単に可視化を行うことができます。
loc = [187 75 82 63];     % 例:座標が解析により得られたとした例
A1 = insertShape(A, 'Rectangle', loc, 'Color', 'cyan', 'LineWidth', 3);
figure; imshow(A1);
結果の書き出し
結果を画像ファイルとして簡単に書き出せます。
imwrite(A1, 'tmp_result.png');
歯車の欠け検出を例にした静止画処理ワークフロー
歯車の画像を読み込んで歯車の欠けを検出例を用いて実際の静止画処理のワークフローを紹介します。
画像の読込み
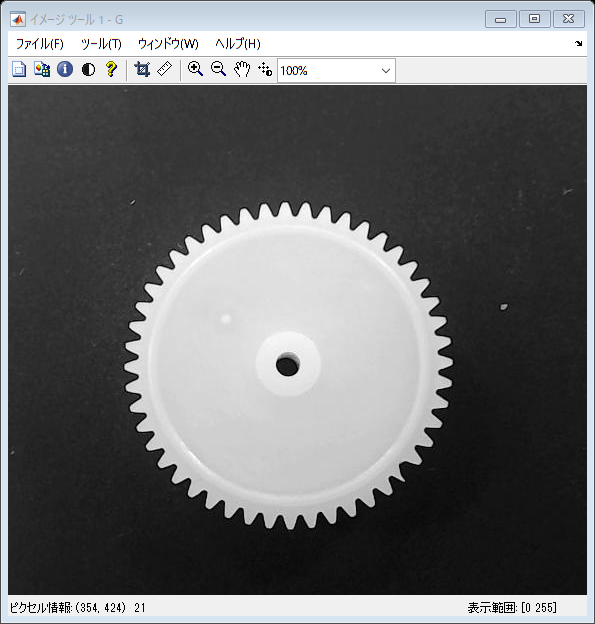
G = imread('I2_01_3_gear7g.jpg'); % 変数宣言不要。容易な多次元配列取扱い
imtool(G);                   % 容易な可視化
前処理:二値(白黒)画像に変換
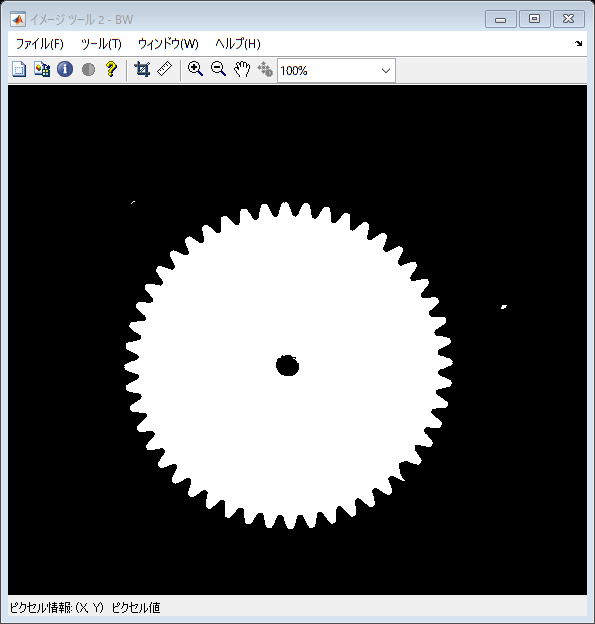
2値化します。
BW = G > 130;     % 二次元の配列と、数値の比較。自動閾値設定:BW=im2bw(G, graythresh(G));     150
imtool(BW);       % ピクセル値を確認 (0と1の、2値画像)
フィルタ処理:トップハット フィルタ処理で、歯の部分を抽出
モルフォロジー処理(形態素処理)を行います。元画像からオープニング画像を引くことで歯車の歯の部分を抽出します。
%トップハットフィルタ処理を1つの関数で実行も可能
% BWtoph = imtophat(BW, strel('Disk',30,8));
収縮処理を実行します。
BWerode = imerode(BW, strel('Disk',30,8));          % 収縮
imshow(BWerode);
膨張処理を実行します。これにより指定した半径以下の領域が削られます。
BWdilate = imdilate(BWerode, strel('Disk',30,8));   % 膨張
figure;imshow(BWdilate);
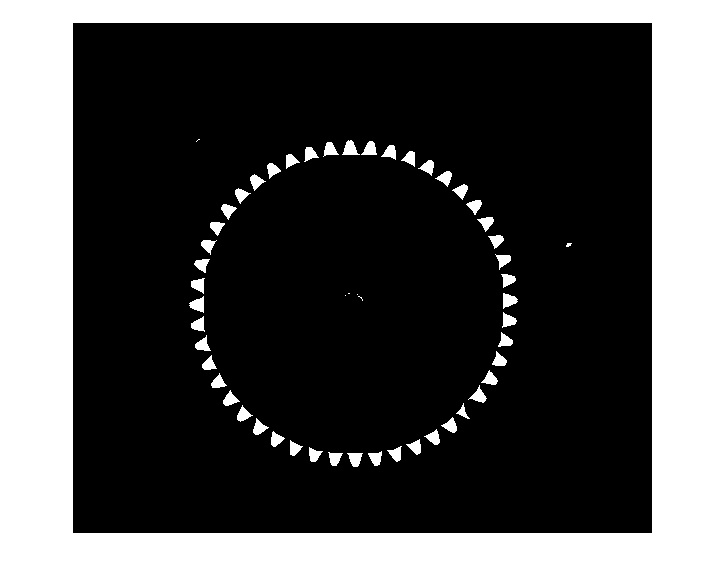
元の画像からオープニング画像を引き算し、歯車の歯の部分を抽出します。
BWtoph = imsubtract(BW, BWdilate);       % 元画像 - Opening画像
imshow(BWtoph);
後処理:細かなノイズの除去
後処理として残った小さなゴミを除去します。今回は50ピクセルをしきい値としてそれ以下のものは歯ではなくノイズとして除去します。
BWclear = bwareaopen(BWtoph, 50); % 50ピクセル以下のものを削除
imshow(BWclear);
途中結果の可視化
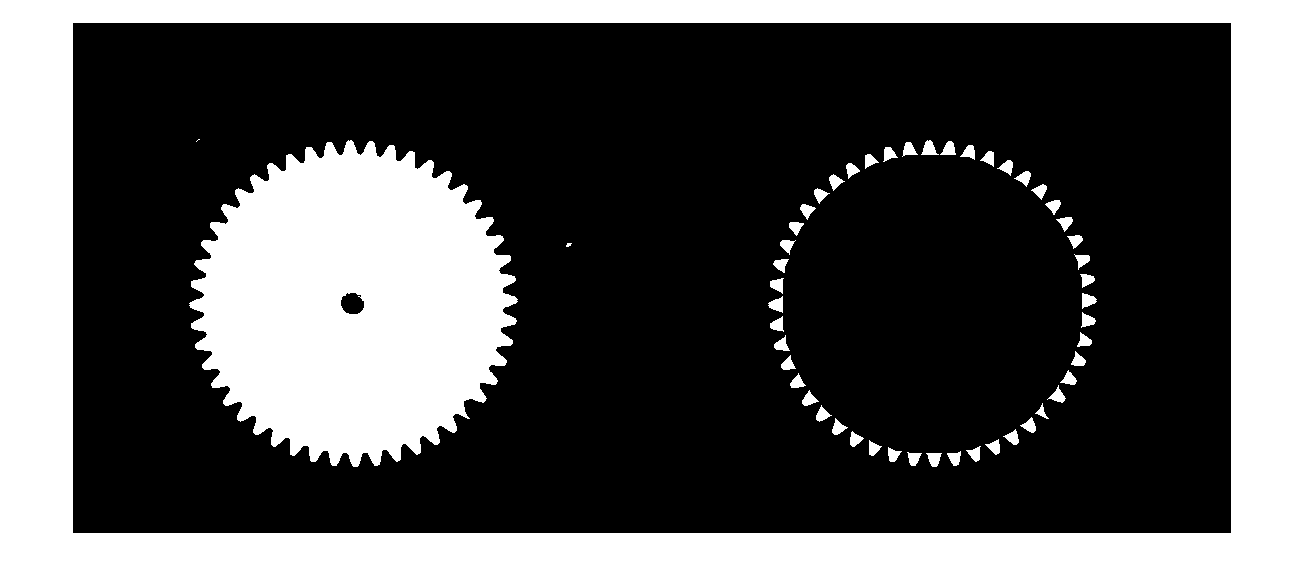
ここまでの結果を、並べて表示します。
figure; imshowpair(BW, BWclear, 'montage');shg;
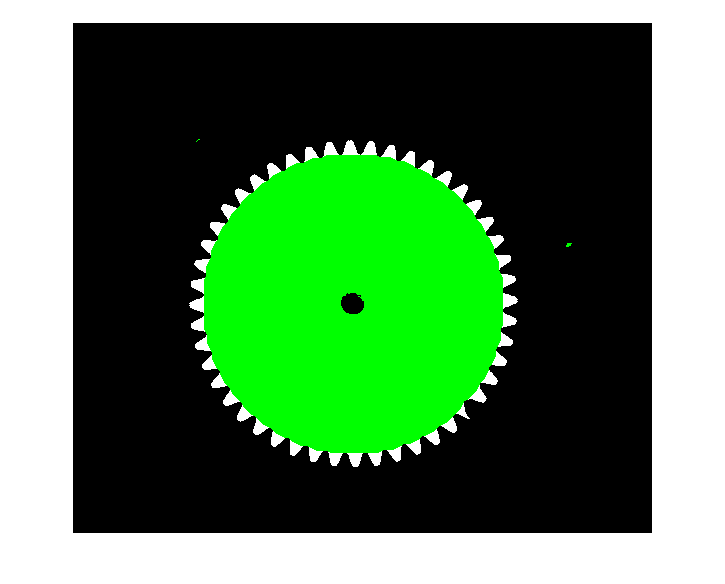
2つの画像を重ねて表示します。
imshowpair(BW, BWclear);shg; % 白:変化ない部分、緑:元の画像のみに存在
計測:各歯の面積と中心点の測定
各歯の領域の面積と重心を計算します。面積の小さい順に並び替え、極端に小さい領域があれば欠けと判断できます。
stats = regionprops('table', BWclear, 'Area', 'Centroid');
sortrows(stats) % 面積の小さい順にソート
| Area | Centroid | ||
|---|---|---|---|
| 1 | 77 | 390.4935 | 389.8571 |
| 2 | 119 | 218.4454 | 138.2521 |
| 3 | 121 | 222.1570 | 426.0496 |
| 4 | 124 | 241.8387 | 432.3790 |
| 5 | 125 | 144.3200 | 204.7120 |
| 6 | 126 | 136.5476 | 341.9683 |
| 7 | 126 | 200.2778 | 147.4286 |
| 8 | 127 | 135.6220 | 222.8898 |
| 9 | 127 | 168.7717 | 172.4094 |
| 10 | 127 | 424.1260 | 218.0079 |
| 11 | 128 | 337.5859 | 135.8047 |
| 12 | 128 | 432.9141 | 318.5000 |
| 13 | 129 | 203.8372 | 417.0078 |
| 14 | 129 | 323.5271 | 431.4806 |
グラフ化: ヒストグラムの表示
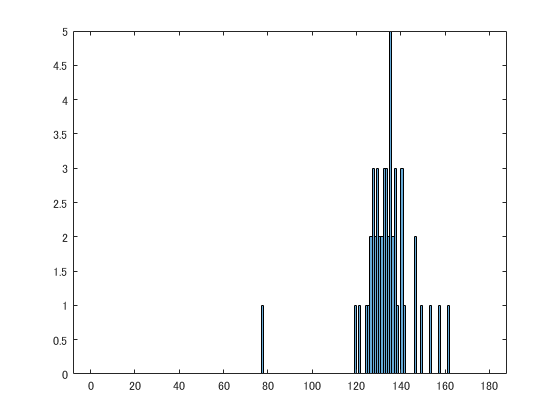
ヒストグラムとして面積の分布を確認することもできます。欠けのある歯車は正常な歯の面積の集団から離れています。
figure; histogram([stats.Area], 1:179);
結果の可視化
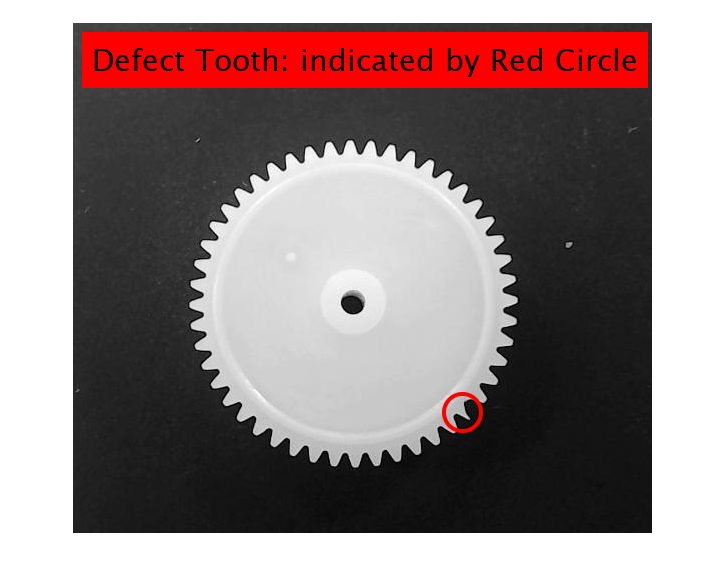
欠けのある場所を可視化し、目視で確認します。
ind = find([stats.Area] < 100);  % ベクトルと数値の比較
Gresult2 = insertShape(G, 'Circle', [stats.Centroid(ind,:) 18], 'LineWidth',4, 'Color','red', 'Opacity',1);
Gresult3 = insertText(Gresult2, [10, 10], 'Defect Tooth: indicated by Red Circle', 'FontSize', 30, 'BoxColor','red', 'BoxOpacity',1);
imshow(Gresult3);
まとめ
MATLABによる画像処理の静止画のワークフローをご紹介しました。
お手持ちの画像でお試しください。
参考
謝辞
本記事は @eigs さんのlivescript2markdownを使わせていただいてます。
