目次へのリンク
概要
MATLABには画像表示に便利な関数が複数用意されています。
- 単一画像の表示(
imshow) - 2つの画像の表示(
imshowpair) - 複数画像の表示(
montage) - イメージビューワー(
imtool) - ボリュームビューワー(
volumeViewer) - DICOMブラウザー(
dicomBrowser) - スライスビューワー(
sliceViewer) - オルソスライスビューワー(
orthosliceViewer)
表示対象に合わせて適切なツールを活用しましょう。
対応ファイル
画像の表示(imshow)
画像の表示はimshow関数が利用できます。
code
A=imread('peppers.png');
imshow(A);

2つの画像を並べて表示(imshowpair)
2つの画像を並部手表示できます。
code
B=imread('street1.jpg');
imshowpair(A,B,'montage');

2つの画像を重ねて表示することもできます。
code
imshowpair(A,B);

モンタージュ表示
code
load mri;                   % MATファイルから、データの読込み
montage(D,map);truesize;shg % モンタージュ表示

イメージビューアー:各種調査用ツール
code
imtool(A) % 画像ビューアー アプリケーション

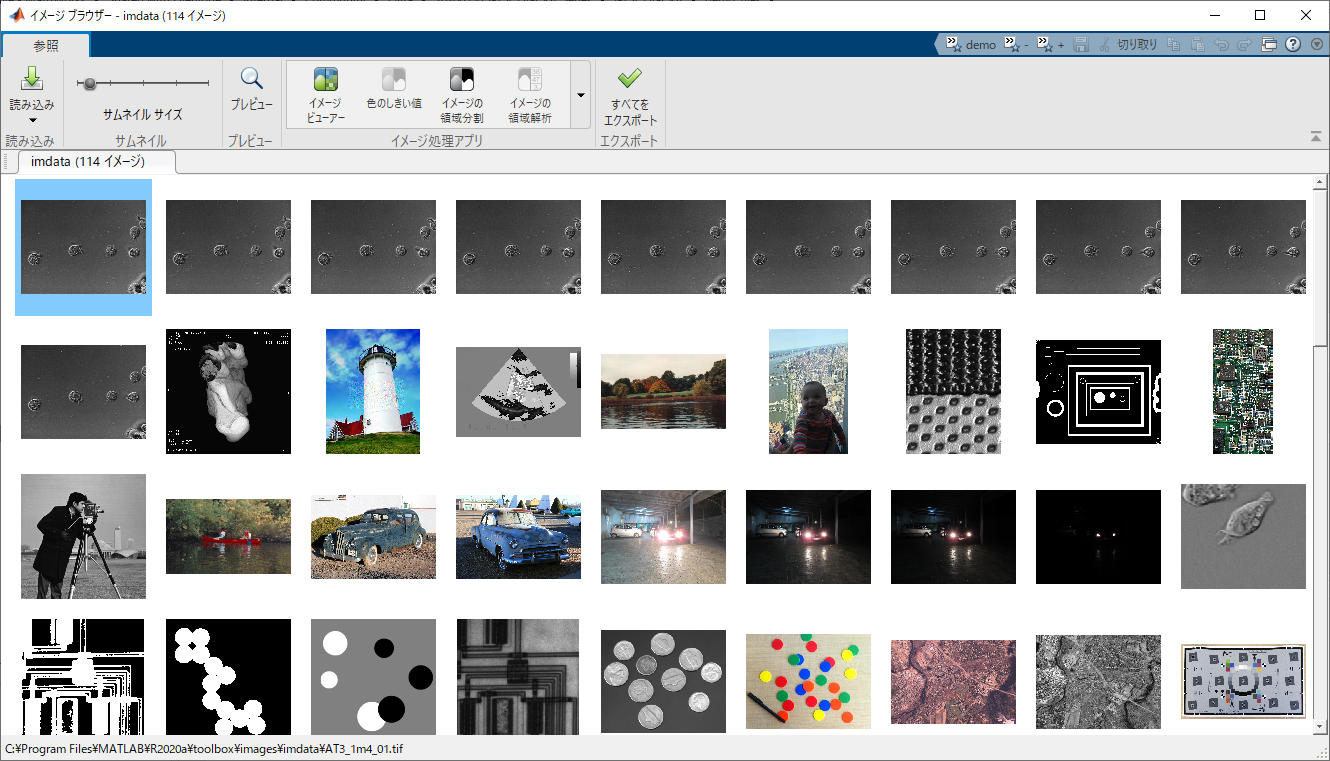
イメージブラウザ:フォルダ内の様々なサイズ・データ型の画像を一覧表示
code
imageBrowser(fullfile(matlabroot,'toolbox','images','imdata'));
ボリュームビューアー
code
load mri           % 128x128x1x27    画像の取込み
D1 = squeeze(D);   % 128x128x27      27枚のスライス画像
volumeViewer(D1)   % ボリュームビューワーの起動
   % ボリュームの読込み
	 % 立方体にアップサンプリング
	 % 表示: ボリューム <=> スライス平面

テクスチャマッピング
code
load clown                % MATファイルから、画像データ'X'の読込み
figure;imshow(X,map);     % 画像表示

code
[x,y,z]=cylinder;         % 円柱座標生成
figure;mesh(x,y,z,'edgecolor',[0 0 0]);axis square;  %座標表示

code
warp(x,y,z,flipud(X),map);axis square;shg %テクスチャマッピング

DICOMブラウザーによるファイルの確認
code
dicomBrowser(fullfile(matlabroot,'toolbox','images','imdata'))

スライスビューワー
code
sliceViewer(D1);

オルソスライスビューワー
code
orthosliceViewer(D1);

任意の切断面の作成と可視化
code
point = [73 50 15.5]; % 切断平面上の点
normal = [0 15 20]; % 法線ベクトル
[B,x,y,z] = obliqueslice(D1,point,normal);
figure;
surf(x,y,z,B,'EdgeColor','None');

DICOM-RTの読み込みと可視化
code
info = dicominfo('rtstruct.dcm')
output
info =
                              Filename: 'C:\Program Files\MATLAB\R2020a\toolbox\images\imdata\rtstruct.dcm'
                           FileModDate: '03-6-2019 13:27:31'
                              FileSize: 1910148
                                Format: 'DICOM'
                         FormatVersion: 3
                                 Width: []
                                Height: []
                              BitDepth: []
                             ColorType: ''
        FileMetaInformationGroupLength: 214
            FileMetaInformationVersion: [2x1 uint8]
               MediaStorageSOPClassUID: '1.2.840.10008.5.1.4.1.1.481.3'
            MediaStorageSOPInstanceUID: '1.3.6.1.4.1.9590.100.1.2.19011082236500333523568627692152273876'
                     TransferSyntaxUID: '1.2.840.10008.1.2.1'
                ImplementationClassUID: '1.3.6.1.4.1.9590.100.1.3.100.9.4'
             ImplementationVersionName: 'MATLAB IPT 9.4'
                           SOPClassUID: '1.2.840.10008.5.1.4.1.1.481.3'
                        SOPInstanceUID: '1.3.6.1.4.1.9590.100.1.2.19011082236500333523568627692152273876'
                             StudyDate: ''
                             StudyTime: ''
                       AccessionNumber: ''
                              Modality: 'RTSTRUCT'
                          Manufacturer: 'MathWorks'
                       InstitutionName: ''
                ReferringPhysicianName: [1x1 struct]
                           StationName: ''
                     SeriesDescription: ''
                 ManufacturerModelName: 'MATLAB'
                           PatientName: [1x1 struct]
                             PatientID: ''
                      PatientBirthDate: ''
                            PatientSex: ''
                      StudyInstanceUID: '1.2.826.0.1.3680043.8.274.1.1.2729954696.96242.3632970675.507'
                     SeriesInstanceUID: '1.2.826.0.1.3680043.8.274.1.1.7145442384.75872.7982248107.258'
                               StudyID: ''
                          SeriesNumber: []
                        InstanceNumber: []
                     StructureSetLabel: ''
                      StructureSetName: ''
                      StructureSetDate: ''
                      StructureSetTime: ''
    ReferencedFrameOfReferenceSequence: [1x1 struct]
               StructureSetROISequence: [1x1 struct]
                    ROIContourSequence: [1x1 struct]
             RTROIObservationsSequence: [1x1 struct]
ROI情報を抽出
code
contour = dicomContours(info)
output
contour =
  dicomContours のプロパティ:

    ROIs: [2x5 table]
可視化
code
figure;
plotContour(contour);

参考
謝辞
本記事は @eigs さんのlivescript2markdownを使わせていただいてます。