TL;DR
Kubernetes環境で、サンプルアプリケーションのメトリクスを
Prometheusで収集してみました。
この記事では、
メトリクス収集周りの設定について説明します。
Github: https://github.com/cacapouh/prometheus-example-k8s
メトリクス収集の構成
以下はメトリクス収集の構成を箇条書きにしたものです。
defaultネームスペースにサンプルアプリケーションをデプロイし、
そのServiceをmonitoringネームスペースのServiceMonitorで監視することにより、
メトリクスを収集します。
-
defaultネームスペース- サンプルアプリのDeployment
- サンプルアプリのService
-
monitoringネームスペース- ServiceMonitor
- Prometheus周りのオブジェクト
k8s環境の構築
まず、minikubeを使ってKubernetes環境を立ち上げます。
minikube start --memory=4096 # メモリのデフォルト値は2GBで気持ちやや少なめなので、4GBで起動
Prometheusの導入
以下のコマンドで、Prometheusをインストールします。
helm repo add prometheus-community https://prometheus-community.github.io/helm-charts
kubectl create ns monitoring
helm upgrade -i prometheus prometheus-community/kube-prometheus-stack \
--namespace monitoring \
--set prometheus.prometheusSpec.serviceMonitorSelectorNilUsesHelmValues=false \
--set fullnameOverride=prometheus
使用するHelmチャート: https://github.com/prometheus-community/helm-charts/tree/main/charts/kube-prometheus-stack#kube-prometheus-stack
サンプルアプリケーションの用意
以下はサンプルアプリケーションの実装及びDockerfileです。
このアプリケーションが公開しているエンドポイントは2つあります。
- 8080ポートの
/でversion: 1.0.0という文字列を返すようにしています - 8000ポートでメトリクス取得用エンドポイント
/metricsを公開しています-
request_processing_secondsという名称で、8080ポートの/エンドポイントの関数実行時間を計測するようにしています
-
from bottle import route, run, response
from prometheus_client import start_http_server, Summary, generate_latest

REQUEST_TIME = Summary('request_processing_seconds', 'Time spent processing request')
count = 0


@route('/')
@REQUEST_TIME.time()
def index():
    global count
    count += 1
    print("Request: {}".format(count))
    return "version: 1.0.0"


@route('/metrics')
def metrics():
    response.content_type = 'text/plain; version=0.0.4; charset=utf-8'
    return generate_latest()


if __name__ == '__main__':
    start_http_server(8000)
    run(host='0.0.0.0', port=8080)
FROM python:3.8.18-slim

WORKDIR /app
COPY requirements.txt /app

RUN pip install -r requirements.txt

COPY main.py /app

ENTRYPOINT python main.py
minikube image build -t simple-app:latest .
サンプルアプリケーションのマニフェスト
以下はサンプルアプリケーションのマニフェストです。
Podの8080ポートの/及び8000ポートの/metricsが外部からアクセスできるように、
ServiceとDeploymentの設定をしています。
また、ポート設定は以下のようにしています。
- 対象Serviceの
appポートにリクエストが来た場合、
Podの8080にリクエストが来ます - 対象Serviceの
prometheusポートにリクエストが来た場合、
Podの8000にリクエストが来ます
apiVersion: apps/v1
kind: Deployment
metadata:
  name: simple-app
spec:
  replicas: 3
  selector:
    matchLabels:
      app: simple-app
  template:
    metadata:
      labels:
        app: simple-app
    spec:
      containers:
      - name: simple-app
        image: simple-app:latest
        imagePullPolicy: IfNotPresent
        ports:
        - containerPort: 8080
---
apiVersion: v1
kind: Service
metadata:
  name: simple-app
  labels:
    app: simple-app
spec:
  selector:
    app: simple-app
  ports:
    - protocol: TCP
      port: 80
      targetPort: 8080
      name: "app"
    - protocol: TCP
      port: 8000
      targetPort: 8000
      name: "prometheus"
  type: LoadBalancer
以下はデプロイ後のPod情報です。
$ kubectl get pods
NAME                          READY   STATUS    RESTARTS   AGE
simple-app-849bb7b75c-6n4wh   1/1     Running   0          40h
simple-app-849bb7b75c-v9cp9   1/1     Running   0          40h
simple-app-849bb7b75c-w4dgw   1/1     Running   0          40h
Podへのリクエスト送信:
$ curl 'http://127.0.0.1:52492' # urlはminikube service simple-app --urlで取得
version: 1.0.0

$ curl 'http://127.0.0.1:52492/metrics'
# HELP python_gc_objects_collected_total Objects collected during gc
# TYPE python_gc_objects_collected_total counter
python_gc_objects_collected_total{generation="0"} 91.0
python_gc_objects_collected_total{generation="1"} 257.0
python_gc_objects_collected_total{generation="2"} 0.0
# HELP python_gc_objects_uncollectable_total Uncollectable objects found during GC
# TYPE python_gc_objects_uncollectable_total counter
python_gc_objects_uncollectable_total{generation="0"} 0.0
python_gc_objects_uncollectable_total{generation="1"} 0.0
python_gc_objects_uncollectable_total{generation="2"} 0.0
# HELP python_gc_collections_total Number of times this generation was collected
# TYPE python_gc_collections_total counter
python_gc_collections_total{generation="0"} 44.0
python_gc_collections_total{generation="1"} 3.0
python_gc_collections_total{generation="2"} 0.0
# HELP python_info Python platform information
# TYPE python_info gauge
python_info{implementation="CPython",major="3",minor="8",patchlevel="18",version="3.8.18"} 1.0
# HELP process_virtual_memory_bytes Virtual memory size in bytes.
# TYPE process_virtual_memory_bytes gauge
process_virtual_memory_bytes 1.80051968e+08
# HELP process_resident_memory_bytes Resident memory size in bytes.
# TYPE process_resident_memory_bytes gauge
process_resident_memory_bytes 2.1827584e+07
# HELP process_start_time_seconds Start time of the process since unix epoch in seconds.
# TYPE process_start_time_seconds gauge
process_start_time_seconds 1.70827216297e+09
# HELP process_cpu_seconds_total Total user and system CPU time spent in seconds.
# TYPE process_cpu_seconds_total counter
process_cpu_seconds_total 38.9
# HELP process_open_fds Number of open file descriptors.
# TYPE process_open_fds gauge
process_open_fds 7.0
# HELP process_max_fds Maximum number of open file descriptors.
# TYPE process_max_fds gauge
process_max_fds 1.048576e+06
# HELP request_processing_seconds Time spent processing request
# TYPE request_processing_seconds summary
request_processing_seconds_count 2.0
request_processing_seconds_sum 0.003940082970075309
# HELP request_processing_seconds_created Time spent processing request
# TYPE request_processing_seconds_created gauge
request_processing_seconds_created 1.708272163562513e+09
ServiceMonitorの定義
ServiceMonitorは、Prometheus Operatorによって提供されるカスタムリソースの一つです。
このServiceMonitor設定では、defaultネームスペースの app: simple-appというラベルを持ったServiceを監視対象とし、prometheusポートの/metricsエンドポイントからメトリクスを収集するようにしています。
apiVersion: monitoring.coreos.com/v1
kind: ServiceMonitor
metadata:
  name: simple-app
  namespace: monitoring
spec:
  endpoints:
    - path: /metrics
      port: "prometheus"
      interval: 5s
  namespaceSelector:
    matchNames:
      - default
  selector:
    matchLabels:
      app: simple-app
メトリクスをPrometheusのWeb UIで可視化
以下は取得されたメトリクスをPrometheusのWeb UIで可視化した結果です。
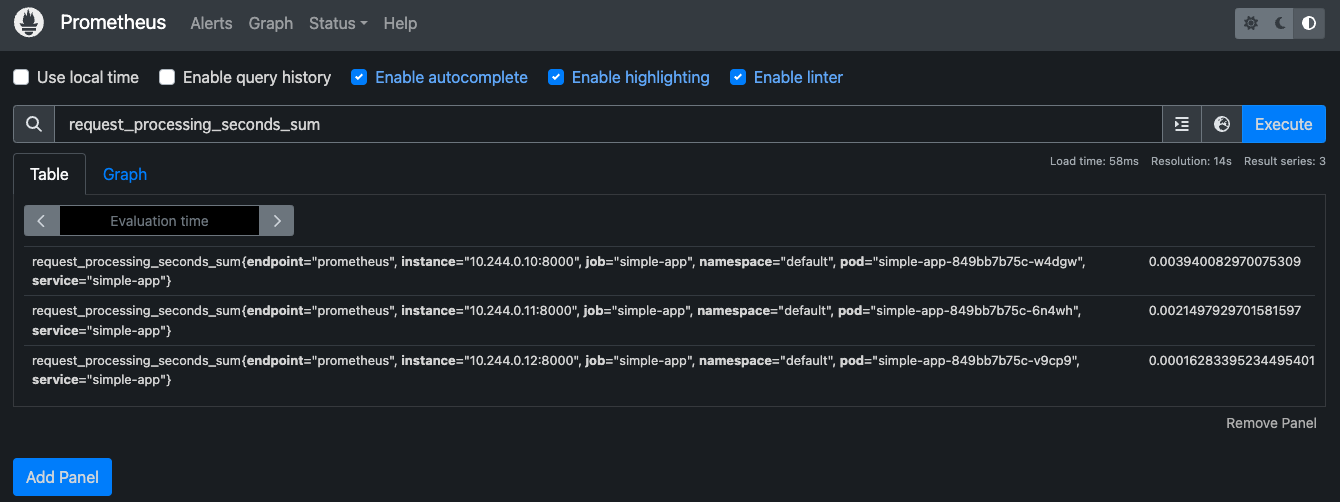
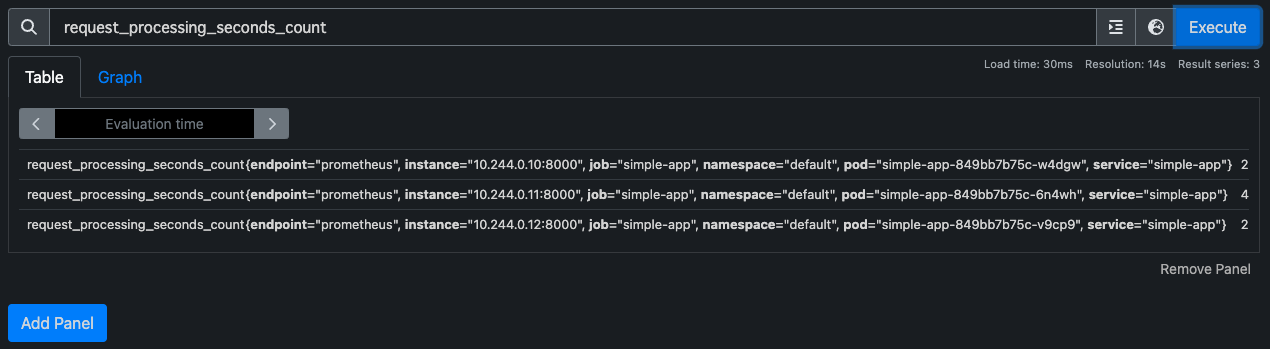
おわりに
サンプルアプリの/metricsエンドポイントで提供したメトリクスが
Web UIを通してPrometheusで取得できていることが確認できました。