この記事の概要
今年度(記事を記載している2022年度)にほぼ初めてPythonを覚え、データ可視化の方法などを一通り覚えた駆け出しデータサイエンティストですが、未だにMatplotlibが使いこなせないので、この際だから頭の整理をしてしまおう! というものになります。
Matplotlibには2つの記述方法がある
あまり英語が得意じゃないのですが、Matplotlibの公式サイトを読み解きながら、2つの方法をまとめていきます。
その1."pyplot"による方法
とりあえずネットにあるコードをぺたぺた貼るときに、大体初めに覚えるものです。
公式サイトでは「like MATLAB」と書いてありますね。ついでに
「オブジェクト指向よりフレキシブルじゃないから、Axesオブジェクトから呼び出すのがいいよ!」
と言っているようです(若干意訳気味ですが)。
import pandas as pd
import numpy as np
import matplotlib.pyplot as plt
とりあえずおまじないのようにこれを書いて、
plt.hist(df)
plt.bar()
などと書くことで、それらしいヒストグラムや棒グラフを作ることができます。
その2.「オブジェクト指向」による方法(Axesオブジェクトを使う方法)
上記でも触れられている「オブジェクト指向」による書き方ということになります。
fig,ax = plt.subplots()
ax.plot(x,y)
のような感じで書きます。
ただ、これだけだと「どっちでもいいんじゃない?」となりそうですね。
「オブジェクト指向」をお勧めする理由
個人的にKaggleとかのデータを触ってみて思ったのは、「変数が多いデータを可視化するときに、5×5のマトリックスにしないと見づらくてしょうがない!」といったようなことが多かったので、オブジェクト指向による方法のほうがうまく書きやすいと思いました。
def hist_and_bar(df,bins=10):
    # df:DataFrame
    len_col = len(df.columns)
    ax_col = np.sqrt(len_col).astype(int)
    ax_row = len_col // ax_col
    if ax_row * ax_col < len_col:
        ax_row += 1

    fig,ax = plt.subplots(ax_row, ax_col, figsize=(24,24))
    for i, col in enumerate(df.columns):
        if df[col].dtypes !='object':
            ax[i//ax_col, i%ax_col].hist(df[col], bins=bins)
            ax[i//ax_col, i%ax_col].set_title(col)
        else:
            ax[i//ax_col, i%ax_col].bar(df[col].value_counts().index, df[col].value_counts(),color='orange')
            ax[i//ax_col, i%ax_col].tick_params(axis='x',rotation=45)
            ax[i//ax_col, i%ax_col].set_title(col)
例えば、こんな感じで「カラムの型が数値型ならヒストグラム、カテゴリ型なら要素ごとの度数グラフ」としたいときに、オブジェクト指向のほうが記述しやすいなと思いました。
覚えておきたいこと
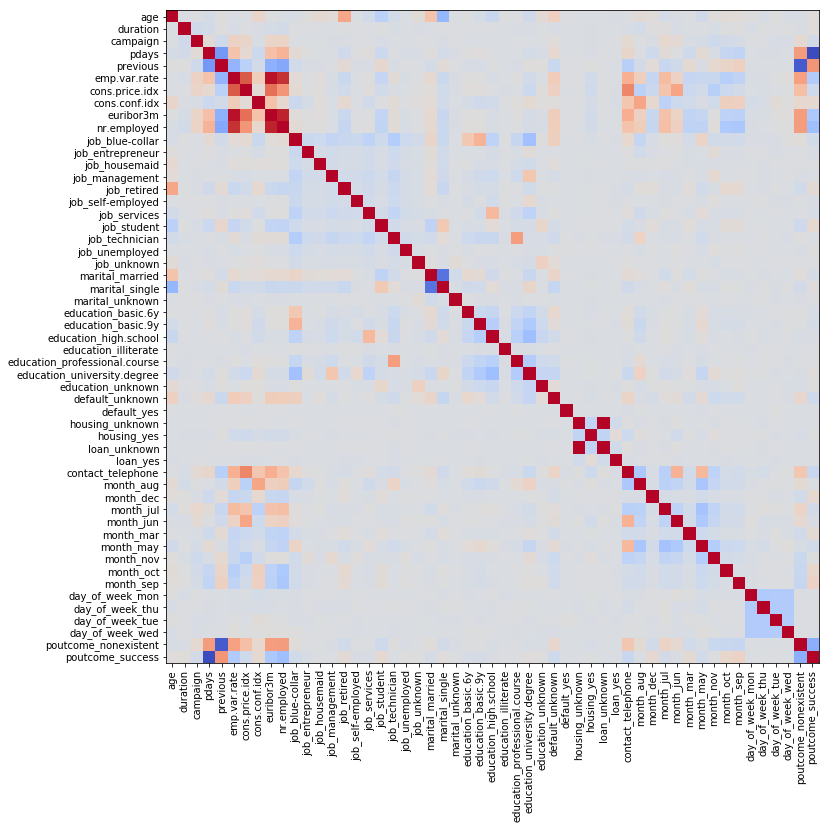
- 特に、データサイエンスで相関係数を可視化するときに、軸の表示方法を知らないと苦労するので、そういうのは覚えておくか、公式サイトのどこを見ればいいか把握しておきましょう。
例えばこんな感です。
# df_X が分析したいデータの説明変数(DataFrame)
df_X_corr=df_X_num.corr()
fig,ax=plt.subplots(figsize=(12,12))
ax.imshow(df_X_corr,cmap='coolwarm')
ax.set_xticks(range(len(df_X_corr.columns)))
ax.set_xticklabels(df_X_corr.columns)
ax.set_yticks(range(len(df_X_corr.columns)))
ax.set_yticklabels(df_X_corr.columns)
ax.tick_params(axis='x',rotation=90);
- グラフをコピペしたときにタイトルやラベルが設定されているほうがいいので、その辺を使いこなせるようにしましょう。
感想
結局Matplotlibの公式サイトにあるCheetSheets/Handoutsをちゃんと見よう、というのが一番ちゃんと理解できることがわかりました。
本当は軸やラベル、タイトルの設定の仕方などもまとめたいと思ったけど、それはまたの機会にします。
