はじめに
【Python】株価データ分析 株価チャートを描く~mplfinance編 その1~では,
mplfinance を使ってローソク足や移動平均線などを描いてみた
今回は,ボリンジャーバンド,MACD,RSIチャートを描いてみる
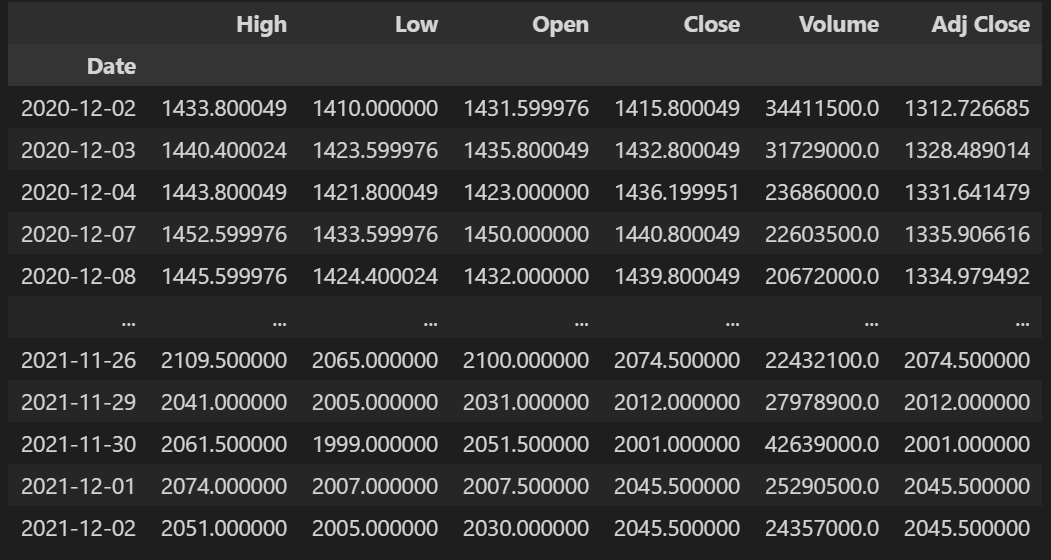
株価データ取得
まずは使用するライブラリのインポートとトヨタの株価データの取得を行う
import numpy as np
import pandas as pd
import pandas_datareader.data as pdr
import datetime
from dateutil.relativedelta import relativedelta
import matplotlib.pyplot as plt
import mplfinance as mpf

# 12か月チャート
month = 12
# チャートの基本設定
kwargs = dict(type = 'candle', style = 'yahoo') ## starsandstripes, yahoo

# 12か月前から本日までのデータを取得する
ed = datetime.datetime.now()
st = ed - relativedelta(months = month)
# トヨタ
df = pdr.DataReader('7203.T', 'yahoo', st, ed)
ボリンジャーバンド,MACD,RSI を計算する関数を用意する
計算式は,次を参考にしています
ボリンジャーバンド
- ±1σ = n日の移動平均 ± n日の標準偏差
- ±2σ = n日の移動平均 ± n日の標準偏差 × 2
- ±3σ = n日の移動平均 ± n日の標準偏差 × 3
<ポイント>価格がバンド内に収まる確率について
- ボリンジャーバンドの±1σの範囲内に収まる確率 ⇒ 約68.3%
- ボリンジャーバンドの±2σの範囲内に収まる確率 ⇒ 約95.4%
- ボリンジャーバンドの±3σの範囲内に収まる確率 ⇒ 約99.7%
def bollingerband(c, period):
    bbma = c.rolling(window=period).mean() ## 平均
    bbstd = c.rolling(window=period).std() ## 標準偏差
    bbh1 = bbma + bbstd * 1
    bbl1 = bbma - bbstd * 1
    bbh2 = bbma + bbstd * 2
    bbl2 = bbma - bbstd * 2
    bbh3 = bbma + bbstd * 3
    bbl3 = bbma - bbstd * 3
    return bbh1, bbl1, bbh2, bbl2, bbh3, bbl3
MACD
- MACD=短期EMA-長期EMA
- MACDシグナル=MACDのEMA
MACDに用いられる移動平均は「単純移動平均(SMA)」ではなく,「指数平滑移動平均(EMA)」を使う
EMAは直近の値動きをより反映するため,SMAと比較して値動きに敏感に反応すると考えられる
<ポイント>
パラメータ値は,短期EMAが12,長期EMAが26,MACDシグナルが9に設定する場合が多い
※ただし,銘柄ごとやマーケット状況に応じてパラメータ値の変更が必要
MACDとMACDシグナルのゴールデンクロスで買い,デッドクロスで売り
※ adjust=False については,pandas.Series.ewmを参照
def macd(c, n1, n2, ns):
    ema_short = c.ewm(span=n1,adjust=False).mean()
    ema_long = c.ewm(span=n2,adjust=False).mean()
    macd = ema_short - ema_long
    signal = macd.ewm(span=ns,adjust=False).mean()
    histogram = macd - signal
    histogramplus = histogram.where(histogram > 0, 0)
    histogramminus = histogram.where(histogram < 0, 0)
    return macd, signal, histogram, histogramplus, histogramminus
RSI
- RS = (n日間の終値の上昇幅の平均) ÷ (n日間の終値の下落幅の平均)
- RSI = 100 -(100 ÷ (RS+1))
<ポイント>
n(パラメータ値)は考案者であるJ.W.ワイルダー氏が最適とする 14(日足)と設定する場合が多い
他パラメータ値としては、日足では9日,22日,42日,52日,週足では9週,13週
## RSI(指数平滑移動平均版)
def rsi(c, period):
    diff = c.diff() #前日比
    up = diff.copy() #上昇
    down = diff.copy() #下落
    up = up.where(up > 0, np.nan) #上昇以外はnp.nan
    down = down.where(down < 0, np.nan) #下落以外はnp.nan
    #upma = up.rolling(window=period).mean() #平均
    #downma = down.abs().rolling(window=period).mean() #絶対値の平均
    upma = up.ewm(span=period,adjust=False).mean() #平均
    downma = down.abs().ewm(span=period,adjust=False).mean() #絶対値の平均
    rs = upma / downma
    rsi = 100 - (100 / (1.0 + rs))
    return rsi
これでボリンジャーバンド,MACD,RSI を計算する関数の用意はできた
チャートを描く
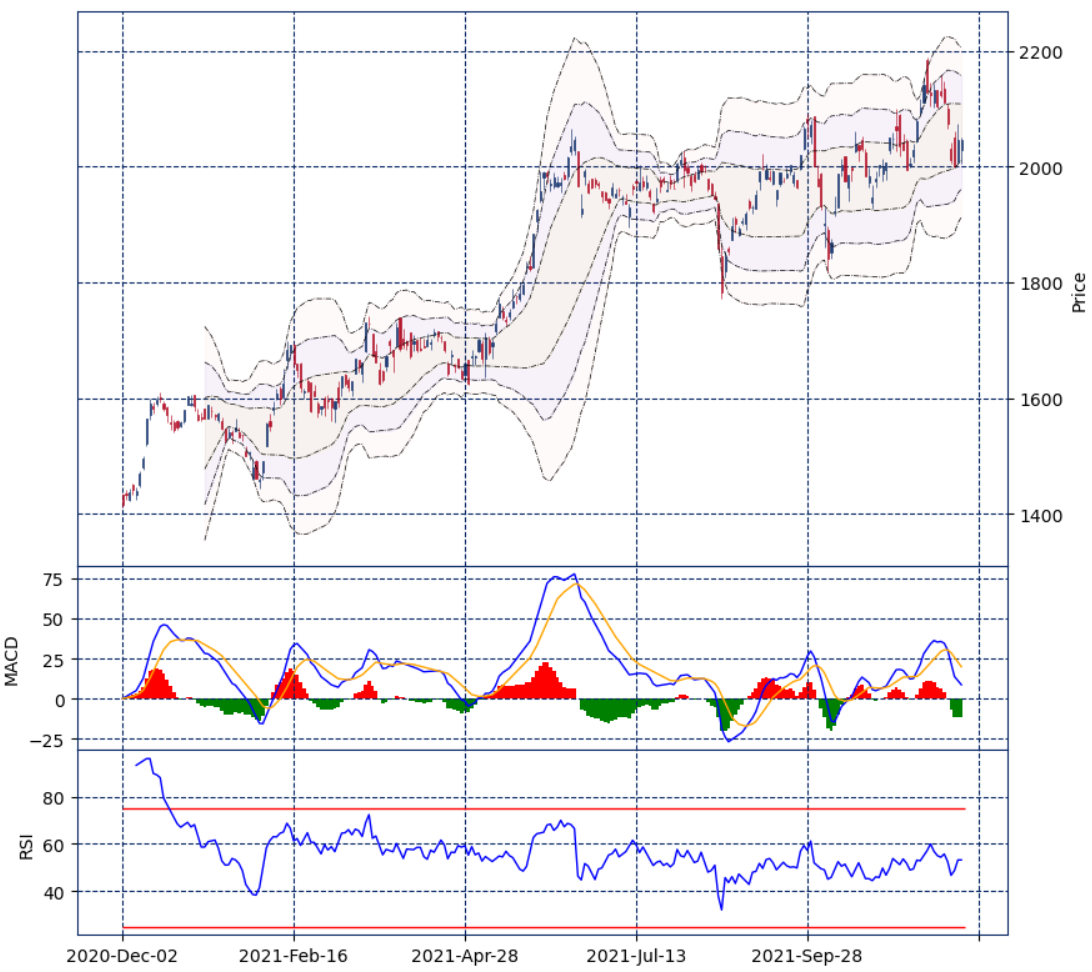
3つのチャートを描きたい
- ローソク足+ボリンジャーバンド(-3σ~+3σ)
- MACD(MACD,シグナル,ヒストグラム)
- RSI(25%と75%に線を引く)
GridSpec を使って,3行1列,高さ比が 3:1:1 のチャートを描くエリアを用意する
# 高さの比を 3:1:1 で GridSpec を用意する
fig = mpf.figure(figsize=(9.6, 9.6), style='starsandstripes')
gs = fig.add_gridspec(3, 1, hspace=0, wspace=0, height_ratios=(3,1,1))
(ax1,ax2,ax3) = gs.subplots(sharex='col')
mplfinance で複数のチャートを描く方法を調べたが,
今のところこの方法が良いと考えている
subplots で得た,(ax1,ax2,ax3) は,
それぞれ,ローソク足+ボリンジャーバンドのaxes,MACDのaxes,RSIのaxesで
後から線や色を塗るときに使える
プロットを作成する際に,mplfinance.make_addplot を呼ぶ
チャートごとにパラメータの辞書を用意しておく
# ボリンジャーバンドは axes No.1 に描く
bbargs = dict(ax=ax1, width=.5, linestyle='dashdot', color='black')
# MACD は axes No.2 に描く
macdargs = dict(ax=ax2, width=1, ylabel='MACD')
# RSI は axes No.3 に描く
rsiargs = dict(ax=ax3, width=1, ylabel='RSI')

# プロットを作成する(ボリンジャーバンド,MACD,RSI)
ap = [
    mpf.make_addplot(bbh1, **bbargs),
    mpf.make_addplot(bbl1, **bbargs),
    mpf.make_addplot(bbh2, **bbargs),
    mpf.make_addplot(bbl2, **bbargs),
    mpf.make_addplot(bbh3, **bbargs),
    mpf.make_addplot(bbl3, **bbargs),
    mpf.make_addplot(macd_, **macdargs, color='blue'),
    mpf.make_addplot(macdsignal, **macdargs, color='orange'),
    mpf.make_addplot(histogramplus, **macdargs, color='red', type='bar'),
    mpf.make_addplot(histogramminus, **macdargs, color='green', type='bar'),
    mpf.make_addplot(rsi_, **rsiargs, color='blue')
]
塗りつぶしは,fill_between を呼ぶ
x に x座標データ,y1 と y2 に y座標データを渡す
その間の領域が塗りつぶされる
# ボリンジャーバンド(axes=1)の間を塗りつぶす(色は適当)
ax1.fill_between(x=range(0, len(df.index)), y1=bbh3.values, y2=bbl3.values, alpha=0.02, color='red')
ax1.fill_between(x=range(0, len(df.index)), y1=bbh2.values, y2=bbl2.values, alpha=0.03, color='blue')
ax1.fill_between(x=range(0, len(df.index)), y1=bbh1.values, y2=bbl1.values, alpha=0.04, color='yellow')
# RSI(axes=3) の25%と75%に線を引く
ax3.hlines(xmin=0, xmax=len(df.index), y=25, linewidth=1, color='red')
ax3.hlines(xmin=0, xmax=len(df.index), y=75, linewidth=1, color='red')
# ローソク足を描く,用意したプロットを渡す
mpf.plot(df, ax=ax1, addplot=ap, style='starsandstripes', type='candle', xrotation=30, ylabel='Price')
まとめ
以下を実行するとこのようなチャートが表示される
import numpy as np
import pandas as pd
import pandas_datareader.data as pdr
import datetime
from dateutil.relativedelta import relativedelta
import matplotlib.pyplot as plt
import mplfinance as mpf

# 12か月チャート
month = 12
# チャートの基本設定
kwargs = dict(type = 'candle', style = 'yahoo') ## starsandstripes, yahoo

# 12か月前から本日までのデータを取得する
ed = datetime.datetime.now()
st = ed - relativedelta(months = month)
# トヨタ
df = pdr.DataReader('7203.T', 'yahoo', st, ed)

def bollingerband(c, period):
    bbma = c.rolling(window=period).mean() ## 平均
    bbstd = c.rolling(window=period).std() ## 標準偏差
    bbh1 = bbma + bbstd * 1
    bbl1 = bbma - bbstd * 1
    bbh2 = bbma + bbstd * 2
    bbl2 = bbma - bbstd * 2
    bbh3 = bbma + bbstd * 3
    bbl3 = bbma - bbstd * 3
    return bbh1,bbl1,bbh2,bbl2,bbh3,bbl3

def macd(c, n1, n2, ns):
    ema_short = c.ewm(span=n1,adjust=False).mean()
    ema_long = c.ewm(span=n2,adjust=False).mean()
    macd = ema_short - ema_long
    signal = macd.ewm(span=ns,adjust=False).mean()
    histogram = macd - signal
    histogramplus = histogram.where(histogram > 0, 0)
    histogramminus = histogram.where(histogram < 0, 0)
    return macd,signal,histogram,histogramplus,histogramminus

def rsi(c, period):
    diff = c.diff() #前日比
    up = diff.copy() #上昇
    down = diff.copy() #下落
    up = up.where(up > 0, np.nan) #上昇以外はnp.nan
    down = down.where(down < 0, np.nan) #下落以外はnp.nan
    #upma = up.rolling(window=period).mean() #平均
    #downma = down.abs().rolling(window=period).mean() #絶対値の平均
    upma = up.ewm(span=period,adjust=False).mean() #平均
    downma = down.abs().ewm(span=period,adjust=False).mean() #絶対値の平均
    rs = upma / downma
    rsi = 100 - (100 / (1.0 + rs))
    return rsi


# float 型に
df['Open'] = df['Open'].astype(float)
df['High'] = df['High'].astype(float)
df['Low'] = df['Low'].astype(float)
df['Close'] = df['Close'].astype(float)
o = df['Open']
c = df['Close']
l = df['Low']
h = df['High']

'''
チャートを描く
'''
# ボリンジャーバンド(移動平均25日線)
bbh1,bbl1,bbh2,bbl2,bbh3,bbl3 = bollingerband(c, 25)
# MACD(短期=12,長期=26,シグナル=9)
macd_,macdsignal,histogram,histogramplus,histogramminus = macd(c,12,26,9)
# RSI(14日)
rsi_ = rsi(c, 14)

# 高さの比を 3:1:1 で GridSpec を用意する
fig = mpf.figure(figsize=(9.6, 9.6), style='starsandstripes')
gs = fig.add_gridspec(3, 1, hspace=0, wspace=0, height_ratios=(3,1,1))
(ax1,ax2,ax3) = gs.subplots(sharex='col')

# ボリンジャーバンドは axes No.1 に描く
bbargs = dict(ax=ax1, width=.5, linestyle='dashdot', color='black')
# MACD は axes No.2 に描く
macdargs = dict(ax=ax2, width=1, ylabel='MACD')
# RSI は axes No.3 に描く
rsiargs = dict(ax=ax3, width=1, ylabel='RSI')

# プロットを作成する(ボリンジャーバンド,MACD,RSI)
ap = [
    mpf.make_addplot(bbh1, **bbargs),
    mpf.make_addplot(bbl1, **bbargs),
    mpf.make_addplot(bbh2, **bbargs),
    mpf.make_addplot(bbl2, **bbargs),
    mpf.make_addplot(bbh3, **bbargs),
    mpf.make_addplot(bbl3, **bbargs),
    mpf.make_addplot(macd_, **macdargs, color='blue'),
    mpf.make_addplot(macdsignal, **macdargs, color='orange'),
    mpf.make_addplot(histogramplus, **macdargs, color='red', type='bar'),
    mpf.make_addplot(histogramminus, **macdargs, color='green', type='bar'),
    mpf.make_addplot(rsi_, **rsiargs, color='blue')
]

# ボリンジャーバンド(axes=1)の間を塗りつぶす(色は適当)
ax1.fill_between(x=range(0, len(df.index)), y1=bbh3.values, y2=bbl3.values, alpha=0.02, color='red')
ax1.fill_between(x=range(0, len(df.index)), y1=bbh2.values, y2=bbl2.values, alpha=0.03, color='blue')
ax1.fill_between(x=range(0, len(df.index)), y1=bbh1.values, y2=bbl1.values, alpha=0.04, color='yellow')
# RSI(axes=3) の25%と75%に線を引く
ax3.hlines(xmin=0, xmax=len(df.index), y=25, linewidth=1, color='red')
ax3.hlines(xmin=0, xmax=len(df.index), y=75, linewidth=1, color='red')
# ローソク足を描く,用意したプロットを渡す
mpf.plot(df, ax=ax1, addplot=ap, style='starsandstripes', type='candle', xrotation=30, ylabel='Price')
mpf.show()
おわりに
今回は,ボリンジャーバンド,MACD,RSIチャートを描いた
次回は,一目均衡表を描きたい

