はじめに
同僚に、海洋の水温データが与えられた時に水温20°Cなどの深さを求めるに、Pythonではどう書けば良いか聞かれた。そこで例を作ってみることにした。やり方はいろいろあると思うが、ここではxarrayを使ってみた。
細かいことを言うと、通じる人にしか通じない質問だが、ferretで let z20 = temp[z=@loc:20]と同じことをPythonでどうやってやれば良いかという質問だった。
データ
例として、World Ocean Atlas 2018から、2005-2017の1°分解能の年平均水温のデータを使用した。データはハワイ大学のAsia-Pacific Data-Research CenterのOpenDapサーバから入手した。
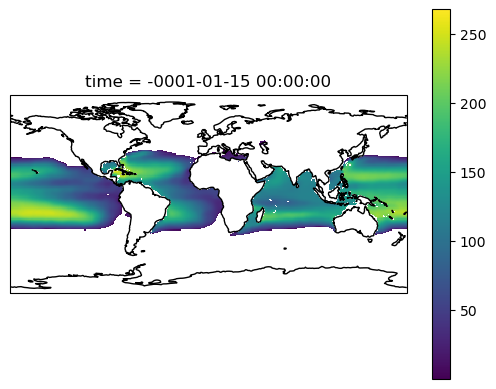
今回の例では、この水温データから水温20℃の深さを求める。
コード
まず一次元の温度tempsと深さdepthsの配列から、温度isotherm_tempの深さを求める関数を定義する。
import numpy as np

def find_isotherm_depth(temps, depths, isotherm_temp):
    # Find index where temperature crosses the isotherm
    # Note: depths should be increasing with index
    idx = np.where(np.diff(np.sign(temps - isotherm_temp)))[0]

    if idx.size == 0:
        return np.nan  # return NaN if no isotherm found

    # For simplicity, we take the first crossing
    idx = idx[0]

    # Perform linear interpolation between the two depths
    x1, x2 = temps[idx], temps[idx + 1]
    y1, y2 = depths[idx], depths[idx + 1]

    isotherm_depth = y1 + (y2 - y1) * (isotherm_temp - x1) / (x2 - x1)
    return isotherm_depth
次にxarrayを使って、OpenDapサーバからデータを呼び出す。
import xarray as xr
ds=xr.open_dataset("http://apdrc.soest.hawaii.edu:80/dods/public_data/WOA/WOA18/1_deg/annual/2005-2017/temp")
print(ds)
dsの中身は
<xarray.Dataset>
Dimensions:  (time: 1, lev: 102, lat: 180, lon: 360)
Coordinates:
  * time     (time) object -0001-01-15 00:00:00
  * lev      (lev) float64 0.0 5.0 10.0 15.0 ... 5.2e+03 5.3e+03 5.4e+03 5.5e+03
  * lat      (lat) float64 -89.5 -88.5 -87.5 -86.5 -85.5 ... 86.5 87.5 88.5 89.5
  * lon      (lon) float64 -179.5 -178.5 -177.5 -176.5 ... 177.5 178.5 179.5
Data variables:
    tan      (time, lev, lat, lon) float32 ...
    tmn      (time, lev, lat, lon) float32 ...
    tdd      (time, lev, lat, lon) float32 ...
    tsd      (time, lev, lat, lon) float32 ...
    tse      (time, lev, lat, lon) float32 ...
    toa      (time, lev, lat, lon) float32 ...
    tgp      (time, lev, lat, lon) float32 ...
Attributes:
    title:          World Ocean Atlas 2018: sea water temperature Annual 2005...
    Conventions:    COARDS\nGrADS
    dataType:       Grid
    documentation:  http://apdrc.soest.hawaii.edu/datadoc/woa18.php
    history:        Mon Apr 17 11:24:59 HST 2023 : imported by GrADS Data Ser...
tanが水温データである。
もとめる深さの温度は
T=20.
とする。
水温データは、深さの他に、経度(lon)・緯度(lat)・時間(time)の次元を持つから、上で定義した関数をこれらの次元で並列に回す。そのためにxarrayのapply_ufuncを使う。
isotherm_depths = xr.apply_ufunc(
    find_isotherm_depth,
    ds.tan, # temperature
    ds.lev, # depth
    input_core_dims=[['lev'], ['lev']],
    kwargs={'isotherm_temp': T},
    vectorize=True,  # Vectorize function over remaining 'x' and 'y' dimensions
    dask='parallelized',  # Enable computation in parallel using dask
    output_dtypes=[float],
)
print(isotherm_depths)
結果のisoterm_depthsは
<xarray.DataArray (time: 1, lat: 180, lon: 360)>
array([[[nan, nan, nan, ..., nan, nan, nan],
        [nan, nan, nan, ..., nan, nan, nan],
        [nan, nan, nan, ..., nan, nan, nan],
        ...,
        [nan, nan, nan, ..., nan, nan, nan],
        [nan, nan, nan, ..., nan, nan, nan],
        [nan, nan, nan, ..., nan, nan, nan]]])
Coordinates:
  * time     (time) object -0001-01-15 00:00:00
  * lat      (lat) float64 -89.5 -88.5 -87.5 -86.5 -85.5 ... 86.5 87.5 88.5 89.5
  * lon      (lon) float64 -179.5 -178.5 -177.5 -176.5 ... 177.5 178.5 179.5
となり、経度(lon)・緯度(lat)・時間(time)の次元を保持している。
最後にプロットしてみる。
import cartopy.crs as ccrs
p=isotherm_depths.isel(time=0).plot.pcolormesh(subplot_kws={"projection": ccrs.PlateCarree()})
p.axes.coastlines()
白状すると
上のようなコードは自分でも書けたはずだが、時間を短縮するためと、好奇心から、コーディングにChatGPTの力を借りた。その時の会話は
https://chat.openai.com/share/d7d5002c-c9b2-4f50-9ffa-666c418e707c 。
ここではChatGPT4を使った。ChatGPT3.5でも試したが、緯度・経度の次元をforループで回すいかにも遅そうなコーディングを提案したり、一見あざやかそうなコードに見えて実は動かないコードを返すなど、この例ではうまく答えを返さなかった。
