# !/usr/bin/python
# -*- coding:utf8 -*-
import numpy as np
import textwrap
import matplotlib; matplotlib.use('Agg')
import matplotlib.pyplot as plt
from pylab import *
from matplotlib.font_manager import FontProperties as FP
### Use Japanese fonts
fprop = FP(fname=r'/cygdrive/c/Windows/Fonts/meiryo.ttc')
### dataset
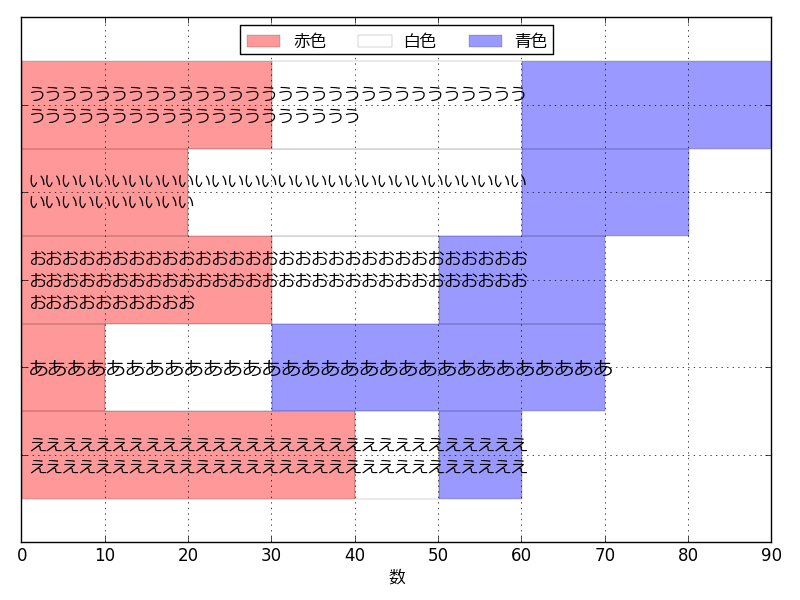
titles = [
u'あ' * 30,
u'い' * 40,
u'う' * 50,
u'え' * 60,
u'お' * 70,
]
n_red = [10, 20, 30, 40, 30]
n_white = [20, 40, 30, 10, 20]
n_blue = [40, 20, 30, 10, 20]
### sorted list
sorted_titles = []
sorted_n_red = []
sorted_n_white = []
sorted_n_blue = []
empty = []
for (title, red, white, blue) in sorted(zip(titles, n_red, n_white, n_blue), key=lambda x:x[1]+x[2]+x[3]):
sorted_titles.append(title)
sorted_n_red.append(red)
sorted_n_white.append(white)
sorted_n_blue.append(blue)
empty.append('')
N = len(titles) ### number of bars
ind = np.arange(1, N * 2, 2) ### positions of bars
width = 2. ### width of a bar
lw = 0.3 ### linewidth
a = 0.4 ### transparency
barh_red = plt.barh(ind, sorted_n_red, width, color='r', linewidth=lw, alpha=a)
bottom = sorted_n_red ### start positions on x-axis of barh_white
barh_white = plt.barh(ind, sorted_n_white, width, bottom, color='w', linewidth=lw, alpha=a)
bottom = [red + white for (red, white) in zip(sorted_n_red, sorted_n_white)] ### start positions on x-axis of barh_blue
barh_blue = plt.barh(ind, sorted_n_blue, width, bottom, color='b', linewidth=lw, alpha=a)
### Ignore yticks here
plt.yticks(ind + width / 2, empty)
legend((u'赤色', u'白色', u'青色'), prop=fprop, loc='upper center', ncol=3)
grid()
xlabel(u'数', fontproperties=fprop)
tight_layout() ### automatically adjusts figure size
for title, rect in zip(sorted_titles, barh_red):
yloc = rect.get_y() + rect.get_height() / 2.0
xloc = 1
text_width = 30
wrapped_texts = textwrap.wrap(title, text_width)
if len(wrapped_texts) > 1:
fs = 12
else:
fs = 14
text(xloc, yloc, textwrap.fill(title, text_width), ha='left', va='center', fontproperties=fprop, fontsize=fs)
savefig('barh.png')