PolarsというPandasを100倍くらい高性能にしたライブラリがとっても良いので布教します。
昔pandas遅いなって思ってpolarsに乗り換えて速さに感動した覚えがあります。普通に布教してもn番煎じになるので、Rust番で布教したいと思います。
実行環境
$ uname -svr
Linux 5.15.0-53-generic #59-Ubuntu SMP Mon Oct 17 18:53:30 UTC 2022$ uname -svr

$ cargo --version
cargo 1.65.0 (4bc8f24d3 2022-10-20)
環境構築
Rustのインストールはこちらから。
適当なディレクトリを作ってからそのディレクトリで
$ cargo init . --bin
でいい感じにしてくれます。
Polars入門
Quick Start
公式 のクイックスタートを一部変えて紹介します。polarsとQuick Startで使用するライブラリをプロジェクトに追加するために以下を [dependencies]に追加します。
# @Cargo.toml
[dependencies]
polars = { version = "0.25.1", features = ["lazy"] }
reqwest =  { version = "0.11.12", features = ["blocking"] }
color-eyre = "0.6"
main.rsをこんな感じにします。
// @src/main.rs
use color_eyre::Result;
use polars::prelude::*;
use reqwest::blocking::Client;
use std::io::Cursor;

fn main() -> Result<()> {
    let data: Vec<u8> = Client::new()
        .get("https://j.mp/iriscsv")
        .send()?
        .text()?
        .bytes()
        .collect();

    let df = CsvReader::new(Cursor::new(data))
        .has_header(true)
        .finish()?
        .lazy()
        .filter(col("sepal_length").gt(5))
        .groupby([col("species")])
        .agg([col("*").sum()])
        .collect()?;

    println!("{:?}", df);

    Ok(())
}
これで実行すると、
$ cargo run
shape: (3, 5)
┌────────────┬──────────────┬─────────────┬──────────────┬─────────────┐
│ species    ┆ sepal_length ┆ sepal_width ┆ petal_length ┆ petal_width │
│ ---        ┆ ---          ┆ ---         ┆ ---          ┆ ---         │
│ str        ┆ f64          ┆ f64         ┆ f64          ┆ f64         │
╞════════════╪══════════════╪═════════════╪══════════════╪═════════════╡
│ virginica  ┆ 324.5        ┆ 146.2       ┆ 273.1        ┆ 99.6        │
├╌╌╌╌╌╌╌┼╌╌╌╌╌╌╌╌╌┼╌╌╌╌╌╌╌╌┼╌╌╌╌╌╌╌╌╌┼╌╌╌╌╌╌╌╌┤
│ versicolor ┆ 281.9        ┆ 131.8       ┆ 202.9        ┆ 63.3        │
├╌╌╌╌╌╌╌┼╌╌╌╌╌╌╌╌╌┼╌╌╌╌╌╌╌╌┼╌╌╌╌╌╌╌╌╌┼╌╌╌╌╌╌╌╌┤
│ setosa     ┆ 116.9        ┆ 81.7        ┆ 33.2         ┆ 6.1         │
└────────────┴──────────────┴─────────────┴──────────────┴─────────────┘
とでてくると思います。貼り付けるとレイアウトが崩れるため、本来の出力はもっときれいです。
解説
最初の
    let data: Vec<u8> = Client::new()
        .get("https://j.mp/iriscsv")
        .send()?
        .text()?
        .bytes()
        .collect();
では reqwestを使ってデータの取得をしています。 Client::new().get("https://j.mp/iriscsv").send()?.text()? で https://j.mp/iriscsv にアクセスして、
sepal_length,sepal_width,petal_length,petal_width,species
5.1,3.5,1.4,0.2,setosa
4.9,3,1.4,0.2,setosa
4.7,3.2,1.3,0.2,setosa
...
のようなcsvフォーマットのデータを取得しています。これを .bytes().collect()でバイト列に変換します。
次の文でデータを読み込み、データフレームに変換しています。
    CsvReader::new(Cursor::new(data))
        .has_header(true)
        .finish()?
この時点で出力すると、
shape: (150, 5)
┌──────────────┬─────────────┬──────────────┬─────────────┬───────────┐
│ sepal_length ┆ sepal_width ┆ petal_length ┆ petal_width ┆ species   │
│ ---          ┆ ---         ┆ ---          ┆ ---         ┆ ---       │
│ f64          ┆ f64         ┆ f64          ┆ f64         ┆ str       │
╞══════════════╪═════════════╪══════════════╪═════════════╪═══════════╡
│ 5.1          ┆ 3.5         ┆ 1.4          ┆ 0.2         ┆ setosa    │
├╌╌╌╌╌╌╌╌╌┼╌╌╌╌╌╌╌╌┼╌╌╌╌╌╌╌╌╌┼╌╌╌╌╌╌╌╌┼╌╌╌╌╌╌┤
│ 4.9          ┆ 3.0         ┆ 1.4          ┆ 0.2         ┆ setosa    │
├╌╌╌╌╌╌╌╌╌┼╌╌╌╌╌╌╌╌┼╌╌╌╌╌╌╌╌╌┼╌╌╌╌╌╌╌╌┼╌╌╌╌╌╌┤
│ 4.7          ┆ 3.2         ┆ 1.3          ┆ 0.2         ┆ setosa    │
├╌╌╌╌╌╌╌╌╌┼╌╌╌╌╌╌╌╌┼╌╌╌╌╌╌╌╌╌┼╌╌╌╌╌╌╌╌┼╌╌╌╌╌╌┤
│ 4.6          ┆ 3.1         ┆ 1.5          ┆ 0.2         ┆ setosa    │
├╌╌╌╌╌╌╌╌╌┼╌╌╌╌╌╌╌╌┼╌╌╌╌╌╌╌╌╌┼╌╌╌╌╌╌╌╌┼╌╌╌╌╌╌┤
│ ...          ┆ ...         ┆ ...          ┆ ...         ┆ ...       │
├╌╌╌╌╌╌╌╌╌┼╌╌╌╌╌╌╌╌┼╌╌╌╌╌╌╌╌╌┼╌╌╌╌╌╌╌╌┼╌╌╌╌╌╌┤
│ 6.3          ┆ 2.5         ┆ 5.0          ┆ 1.9         ┆ virginica │
├╌╌╌╌╌╌╌╌╌┼╌╌╌╌╌╌╌╌┼╌╌╌╌╌╌╌╌╌┼╌╌╌╌╌╌╌╌┼╌╌╌╌╌╌┤
│ 6.5          ┆ 3.0         ┆ 5.2          ┆ 2.0         ┆ virginica │
├╌╌╌╌╌╌╌╌╌┼╌╌╌╌╌╌╌╌┼╌╌╌╌╌╌╌╌╌┼╌╌╌╌╌╌╌╌┼╌╌╌╌╌╌┤
│ 6.2          ┆ 3.4         ┆ 5.4          ┆ 2.3         ┆ virginica │
├╌╌╌╌╌╌╌╌╌┼╌╌╌╌╌╌╌╌┼╌╌╌╌╌╌╌╌╌┼╌╌╌╌╌╌╌╌┼╌╌╌╌╌╌┤
│ 5.9          ┆ 3.0         ┆ 5.1          ┆ 1.8         ┆ virginica │
└──────────────┴─────────────┴──────────────┴─────────────┴───────────┘
みたいに出てきて、データフレームができているのがわかります。
これに集計処理を施すと、
    let df = CsvReader::new(Cursor::new(data))
        .has_header(true)
        .finish()? // DF完成
        .lazy() // 遅延評価のおまじない
        .filter(col("sepal_length").gt(5)) // カラム「sepal_length」の値が5より大きい条件でフィルター
        .groupby([col("species")]) // カラム「species」でグループ化
        .agg([col("*").sum()]) // 和を取る
        .collect()?; // 評価する
最初に見た出力が得られます。
個人的にpolarsの書き方は、メソッドチェーンですらすらかけて好きです。Pythonから使っていたときはエラーメッセージがRust風に出ていてわかりにくそうな印象でした。
その他
可視化
ここまでくると可視化とかしてみたくなりますよね?
そこでいい感じのを見つけたのでついでに試してみた。
Install
Ubuntu で実行する場合、依存関係の追加の前に必要なライブラリをインストールする
$ sudo aptitude install pkg-config libfreetype6-dev libfontconfig1-dev
Cargo.tomlに依存ライブラリを追加する
[dependencies]
plotters = "0.3.4"
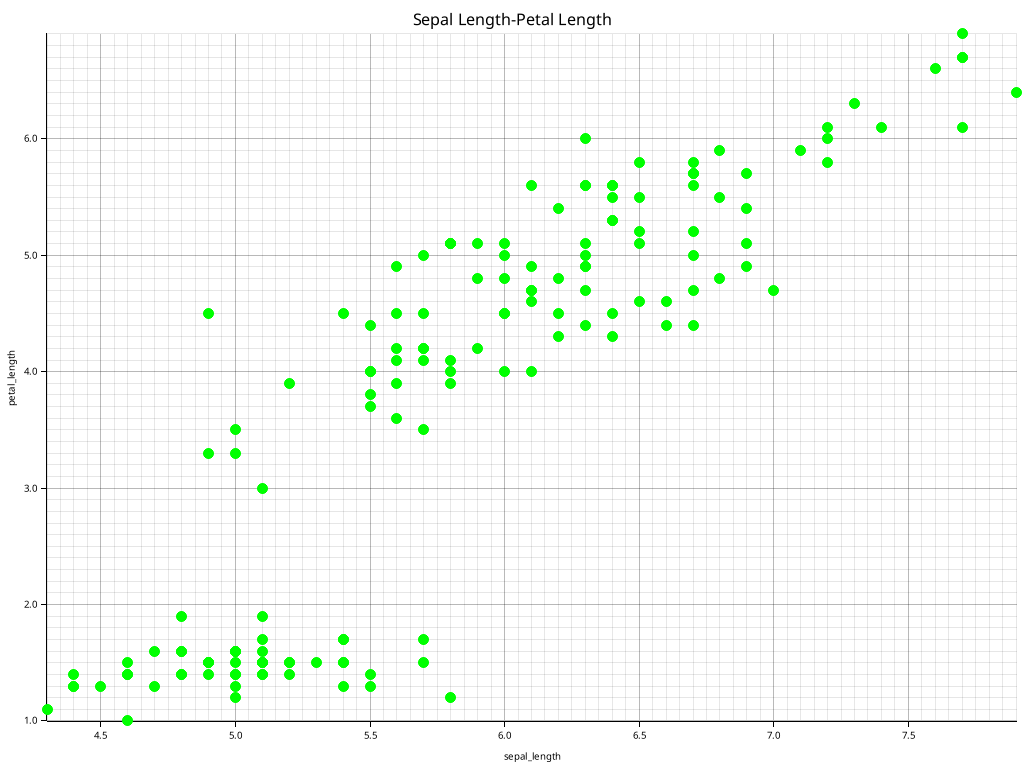
散布図を作成する
これみたいに散布図を書いてみる。
散布図作成の関数
const OUT_FILE_NAME: &'static str = "imgs/scatter.png";

fn scatter<S: AsRef<str>, DB: DrawingBackend>(
    df: &DataFrame,
    x: S,
    y: S,
    caption: S,
    b: DrawingArea<DB, plotters::coord::Shift>,
) -> Result<(), Box<dyn Error>>
where
    DB::ErrorType: 'static,
{
    let x_series = df.column(x.as_ref())?;
    let y_series = df.column(y.as_ref())?;

    let caption_style = TextStyle::from(("sans-serif", 20).into_font());
    let mut scatter_context = ChartBuilder::on(&b)
        .caption(caption, caption_style)
        .margin(7)
        .set_left_and_bottom_label_area_size(40)
        .build_cartesian_2d(as_range(x_series), as_range(y_series))
        .unwrap();
    scatter_context
        .configure_mesh()
        .x_desc(x.as_ref())
        .y_desc(y.as_ref())
        .draw()?;
    scatter_context.draw_series(x_series.iter().zip(y_series.iter()).map(|(x, y)| {
        Circle::new(
            (x.try_extract().unwrap(), y.try_extract().unwrap()),
            5.0,
            GREEN.filled(),
        )
    }))?;

    b.present()?;
    Ok(())
}

fn as_range(s: &Series) -> std::ops::Range<f64> {
    std::ops::Range {
        start: s.min().unwrap(),
        end: s.max().unwrap(),
    }
}
出力
コード量の割に普通のプロットができた。ChartBuilderがDefault traitを実装してくれていたらそのあたりは楽になりそう。知らんけど。
ここまでのコードはhttps://github.com/TM-MT/iris_playground にあります。
インタラクティブにやる
やっぱpythonでデータ分析する人みたいにクールにJupyter使いたいですよね?
はじめにJupyter notebookを入れる
$ sudo aptitude install jupyter-notebook
Rustのカーネルとして Evcxr Jupyter Kernelを使う
$ cargo install evcxr_jupyter
$ evcxr_jupyter --install
標準ライブラリのソースを持っていなければ
$ rustup component add rust-src
でインストール
$ jupyter notebook
と打ってノートブックを起動し、newからRustを選択すると、おなじみのページがRust カーネルで起動します。
Quick Start
さっそくnotebookを使ってpolarsをさわってみましょう。
はじめに依存関係を追加します。セルに
// 依存関係を追加
:dep polars
:dep reqwest
をかき、実行します。時間がかかるのでコーヒーを淹れたりストレッチをして待ってください。
とりあえず公式ドキュメントの最初にあるものをやってみましょう。
use polars::prelude::*;
use reqwest::Client;
Advent calendar に間に合わなくなるのでここであまりの遅さに私は挫折しました。おとなしくpythonからpolarsをさわりましょう。
