d3.js Advent Calendar 2014
http://qiita.com/advent-calendar/2014/d3
この記事に影響を受けて、Rails4+d3.js+garb(Google-analytics-API)でユーザー経路(パス)描画を実装してみました。
http://maulik-kamdar.com/2012/12/visualizing-paths-using-google-analytics/
Google Analyticsにあるフローレポートを補完する位置付けのグラフになります。
https://support.google.com/analytics/answer/2519986?hl=ja
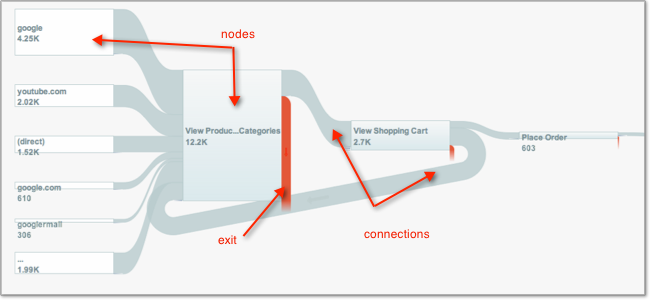
GoogleAnalyticsにあるユーザーの流れを表すフローレポート(上記URLに含まれる画像をもってきました)
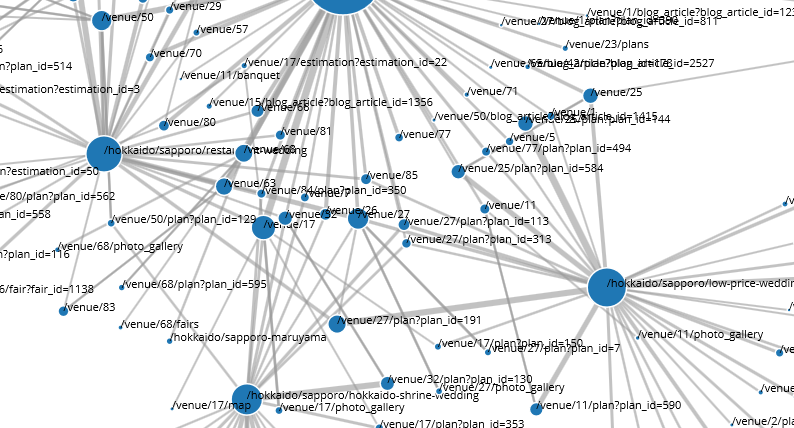
下画像が今回の記事で出力されるグラフの画像。青丸がnodeでページ。線がページからページへと移動したユーザーの多さです。
依存するライブラリ
d3.js
可視化ライブラリで今回はForce-Directed Graphを利用しています。
http://bl.ocks.org/mbostock/4062045
garb
A Ruby wrapper for the Google Analytics API
https://github.com/Sija/garb
GoogleAnalyticsのレポートAPIをRubyから簡単に使うためのgemです。
本題
GoogleAnalyticsAPIの認証
ユーザーとパスワードを利用するか、OAuthを利用する方法で認証を行います。以下はOAuthを使って認証するサンプルコードです。
client = OAuth2::Client.new(client_id, client_secret, :site => 'http://dev.xxxxxxxxxxx.jp:3000/')
session = Garb::Session.new
session.access_token = OAuth2::AccessToken.new(client, google_authentication.value)
profile = Garb::Management::Profile.all(session).find{|v| v.web_property_id == "UA-xxxxxx-x"} #
サンプルで動かすにはユーザーとパスワードを使うのが良いと思います。
Garb::Session.api_key = api_key # required for 2-step authentication
Garb::Session.login(username, password)
今回はウェブアプリを作ってる途中で、Google APIs Console(https://code.google.com/apis/console/) への登録や、Googleとの認証に関する部分が既に実装してあるのでOAuthを使って認証しました。
GoogleAnalyticsAPIからデータを取得
grabを使うと以下のようにレポートのルールを分かりやすく定義できます。PV数を前ページと次に移動したページを軸に取得します。
class GaPageviews
  extend Garb::Model
  metrics :pageviews
  dimensions :previousPagePath, :nextPagePath
end
このクラスを使って、日付を2014/10/1~2014/10/30と指定した結果を取得します。
results = GaPageviews.results(profile, {
  :start_date => Date.new(2014, 10, 1),
  :end_date => Date.new(2014, 10, 30),
  :filters => {:page_path.substring => '/venue'},
  :sort => :pageviews.desc,
})
取得したデータの加工
resultsの内容は以下のようにOpenStructになっていて、ここからPV数と前ページ、次ページが取れます。
# <OpenStruct previous_page_path="(entrance)", next_page_path="/venue/17", pageviews="532">
# <OpenStruct previous_page_path="(entrance)", next_page_path="/venue/45", pageviews="522">
# <OpenStruct previous_page_path="(entrance)", next_page_path="/venue/42", pageviews="510">
次にこの値をd3.jsのForce-Directed Graphで表示するための、ノード一覧とリンク一覧にデータを変換して行きます。
keys = {}
nodes = {}
links = {}

results.each{|v|
  [v.previous_page_path, v.next_page_path].each{|path|
    keys[path] ||= nodes.size
    nodes[path] ||= {
      number: nodes.size,
      name: path,
      group: 1,
      radius: 26,
      type: "uri",
      description: path,
      value: 0,
    }
    nodes[path][:value] += v.pageviews.to_i # ここがノードの丸の大きさ
  }
}

results.each{|v|
  key = (v.previous_page_path + "_x_" + v.next_page_path)
  links[key] ||= {
    name: "#{v.previous_page_path} to #{v.next_page_path}",
    source: keys[v.previous_page_path],
    target: keys[v.next_page_path],
    source_origin: v.previous_page_path,
    target_origin: v.next_page_path,
    value: 0
  }
  links[key][:value] += v.pageviews.to_i # ここがラインの太さ
}

links.keys.each{|key|
  if links[key][:value] < 50 # PVが50に満たないのを切り捨てる
    links.delete(key)
  end
}

# links(線)があるノードを集めて、
active_node_paths = []
links.values.each{|link|
  active_node_paths << link[:source_origin]
  active_node_paths << link[:target_origin]
}

# links(線)がないノードを削除します。
(nodes.keys - active_node_paths.uniq).each{|path|
  nodes.delete(path)
}
keysの内容はこのようにパスとlinksのsourceとtarget(リンクのつながり)で使う数字が入ります。
["(entrance)", 0]
["/venue/17", 1]
["/venue/45", 2]
["/venue/42", 3]
nodesはこのようになります。
["(entrance)", {:number=>0, :name=>"(entrance)", :group=>1, :radius=>26, :type=>"uri", :description=>"(entrance)", :value=>8594}]
["/venue/17", {:number=>1, :name=>"/venue/17", :group=>1, :radius=>26, :type=>"uri", :description=>"/venue/17", :value=>1592}]
["/venue/45", {:number=>2, :name=>"/venue/45", :group=>1, :radius=>26, :type=>"uri", :description=>"/venue/45", :value=>1568}]
linksにはノードとノードを繋ぐための情報が入っていますね。
["(entrance)_x_/venue/17", {:name=>"(entrance) to /venue/17", :source=>0, :target=>1, :source_origin=>"(entrance)", :target_origin=>"/venue/17", :value=>532}]
["(entrance)_x_/venue/45", {:name=>"(entrance) to /venue/45", :source=>0, :target=>2, :source_origin=>"(entrance)", :target_origin=>"/venue/45", :value=>522}]
["(entrance)_x_/venue/42", {:name=>"(entrance) to /venue/42", :source=>0, :target=>3, :source_origin=>"(entrance)", :target_origin=>"/venue/42", :value=>510}]
これをjavascriptから扱えるようにjsonに変換します。
data = {
  nodes: nodes.values,
  links: links.values,
}.to_json
d3.jsでグラフの表示
さあd3に食べさせるデータの準備が出来ました。これでグラフを表示します。
var graph = JSON.parse('<%= data.html_safe %>');
var width = 2400;
var height = 1200;
var color = d3.scale.category20();
var force = d3.layout.force().charge(-360).linkDistance(160).size([width, height]);
var svg = d3.select("svg");

var drawGraph = function(graph) {

    force.nodes(graph.nodes).links(graph.links).start();
    var link = svg.selectAll(".link").data(graph.links).enter().append("line").attr("class", "link").style("stroke-width",
        function(d) {
            return Math.sqrt(d.value);
        });

    var gnodes = svg.selectAll('g.gnode').data(graph.nodes).enter().append('g').classed('gnode', true);

    var node = gnodes.append("circle").attr("class", "node").attr("r", function(d) {
        return Math.sqrt(d.value);
    }).style("fill", function(d) {
        return color(d.group);
    }).call(force.drag);

    var labels = gnodes.append("text").text(function(d) {
        return d.name;
    });

    force.on("tick", function() {
        link.attr("x1", function(d) {
            return d.source.x;
        }).attr("y1", function(d) {
            return d.source.y;
        }).attr("x2", function(d) {
            return d.target.x;
        }).attr("y2", function(d) {
            return d.target.y;
        });
        gnodes.attr("transform", function(d) {
            return 'translate(' + [d.x, d.y] + ')';
        });
    });
};
drawGraph(graph);
SVGを表示するHTMLと簡単なCSS
描画範囲が大きくなりがちなのでスクロールできるようにしています。
<div class="outer">
    <div class="inner">
        <svg></svg>
    </div>
</div>
cssはこんな感じ。
.node {
  stroke: #fff;
  stroke-width: 1.5px;
}

.link {
  stroke: #999;
  stroke-opacity: .6;
}

text {
  font-size: 11px;
}

.outer {
  width: 960px;
  height: 600px;
  overflow: scroll;
}

.inner {
  width: 2400px;
  height: 1200px;
}

svg {
  display: block;
  width: 100%;
  height: 100%;
}
これで冒頭に載せたd3.jsを使ったグラフが描画されます。
フィルターの指定で特定のパス下やカテゴリを指定すると、ディレクトリ単位でのユーザーの動きが分かるので、他ページに回遊して会員登録に至るフローに乗っているのかな?とかユーザーの動きで見えてくる部分があると思います。