Pythonを使ってモンテカルロ法というシミュレーション手法を用いて、ビットコイン価格を予測してみたいと思います。
モンテカルロ法
詳しいアルゴリズムについては省略しますが、乱数を用いたシミュレーション手法です。
実装
データ取得
ビットコイン価格のデータ取得については、
を参照ください。
import pandas as pd
import numpy as np
import matplotlib.pyplot as plt
import time
from datetime import datetime, timedelta

import poloniex

polo = poloniex.Poloniex()
period = polo.DAY # period of data
end = time.time()
start = end - period * 365 # 1 year

BTC = DataFrame.from_dict(polo.returnChartData('USDT_BTC', period=period, start=start, end=end),
dtype=float)
timestamp = BTC['date'].values.tolist() # Series -> ndarray -> list
# timestamp -> year/month/day
date = [datetime.fromtimestamp(timestamp[i]).date() for i in range(len(timestamp))]
BTC.index = pd.to_datetime(date)
モンテカルロ法
関数monte_carloは、モンテカルロ法による計算で、startは初めの値、nは試行回数、dtは1試行あたりの変化量(今回は1日ごとに計算するので、1)、muはデータの平均変化率、sigmaはデータの標準偏差です。
def monte_carlo(start, n, dt, mu, sigma):
    vals = np.zeros(n)
    vals[0] = start

    shocks = np.zeros(n)
    drifts = np.zeros(n)

    for i in range(1, n):
        shocks[i] = np.random.normal(loc=0, scale=sigma*np.sqrt(dt))
        drifts[i] = mu * dt
        prices[i] = vals[i-1] + (vals[i-1] * (drifts[i] + shocks[i]))

    return vals

def simulateMonteCarlo(df, days, runs=5, kind='open'):
    length = len(df) - days
    dt = 1
    returns = df[kind].head(length).pct_change()
    mu = returns.mean()
    sigma = returns.std()

    simudf = DataFrame(df[kind])

    for run in range(runs):
        simu = np.full(len(df), None)
        simu[length:] = monte_carlo(df.iloc[length][kind], days, dt, mu, sigma)

        simudf['Simulate {}'.format(run+1)] = simu

    return simudf
シミュレーション
100日分のデータを使い、後半50日分を10回シミュレーションしてみます。価格はopenを使っています。
simulated = simulateMonteCarlo(BTC.tail(100), 50, runs=10)
plt.plot(simulated)
plt.legend(simulated.columns)

予測
データを訓練用・検証(Validation)用・テスト用に分け、Validationで最も良かったシミュレーションモデルを使ってテストデータを予測してみたいと思います。ValidationでMSEを計算し、MSEが最も小さいシミュレーション結果をベストモデルとしています。
実装を少し変更します。
def predictMonteCarlo(df, days, val_days, runs=5, kind='Open'):
    length = len(df)
    dt = 1
    returns = df[kind].head(length).pct_change()
    mu = returns.mean()
    sigma = returns.std()

    simudf = DataFrame(df[kind])
    preddf = DataFrame(np.full(days, None), columns=[kind])
    preddf.index = pd.date_range(df.tail(1).index.values[0], periods=days+1, freq='D')[1:]
    simudf = pd.concat([simudf, preddf])

    # Simulate
    for run in range(1, runs+1):
        simu = np.full(len(df)+days, None)
        simu[length-val_days:] = monte_carlo(df.iloc[length-val_days][kind], val_days+days, dt, mu, sigma)
        simudf['Simulate {}'.format(run)] = simu

    # Evaluate
    score = []
    val = length - 1
    goal = df[kind][val]
    for run in range(1, runs+1):
        score.append(np.mean(np.square(
            simudf['Simulate {}'.format(run)].iloc[length-val_days:length]
                - simudf[kind].iloc[length-val_days:length])))
    best = np.argmin(score) + 1
    for run in range(1, runs+1):
        if run == best:
            simudf['Best'] = simudf['Simulate {}'.format(run)]
        else:
            simudf['Simulate {}'.format(run)].iloc[len(df):] = None

    print('Best model : ', best)
    return simudf

start = 200
split = 315
train = BTC.iloc[start:split]
test = BTC['Open'].iloc[split-1:]
pred = predictMonteCarlo(train, 50, 50, runs=10)

plt.figure(figsize=(15, 5))
plt.plot(pred['Open'])
plt.plot(test)
plt.plot(pred['Best'])
plt.legend(['Train','Test', 'Predict'])
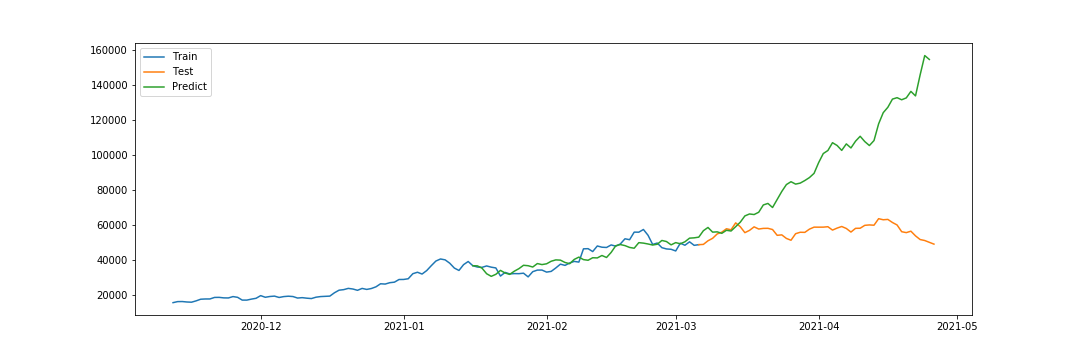
1年分のデータに対し、200日目から315日目までをTrainデータ、315日目から365日目までをTestデータをしています。また、Trainデータの後ろの50日分をValidationとしています。
TrainとPredictが存在する区間がValidationですが、この区間は近い値になっているものの、Testでは大きく違っています。
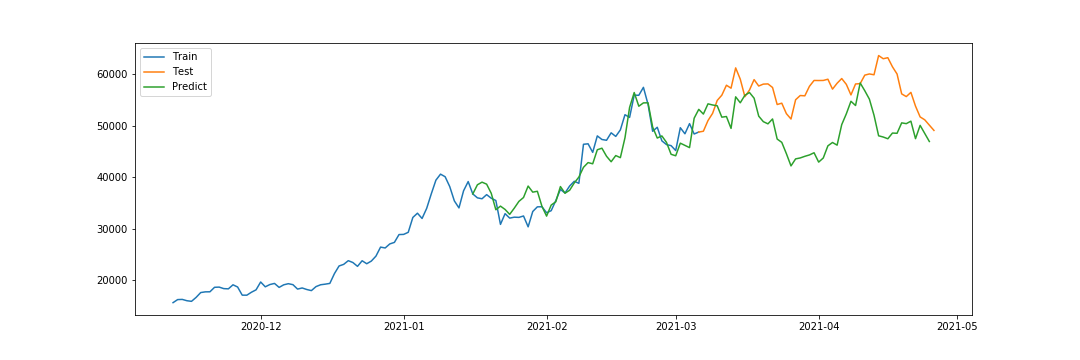
試行回数を1万回に増やしてみました。
Validationはさらにフィットし、Testでの予想結果もかなり近い値になりました。
乱数によるシミュレーションなので、実行するたびに結果は変わります。また、ValidationでフィットしてもTestで大きく違う可能性もあります。
過去の記事
参考サイト

