フィットネストラッカーを使って健康管理に役立てたい
身の回りでスマートウォッチをつけている方がいて、
何ソレおいしいの?的なことから興味を持ち、
なんだったら自分の活動データを貯めて、後で分析できたら面白そうだ!
という軽いノリで使い始めたFitbit Charge3。
元々健康管理には興味があり、「毎日ストレスなく健やかに過ごしたいぞ!」という志もあり、
来る日も来る日も装着してデータを貯めてきました。
2年ほど経つので、APIから安静時心拍数のデータを取得して眺めてみました。
安静時心拍数は1分間に60〜80回ほどが正常値であり、80を超える場合は体に変調をきたしている可能性があるとのこと
オレオレデータを取得するには
Fitbitが収集するデータは、
オレのためのオレのデータで、
それをオレが活用してオレのデータに反映される・・・
という、まさに「オレオレデータ」。
Fitbit公式サイトでアカウントを登録して、
アプリをregisterするとデータを取得するための各種トークンが得られる。
プログラムから認証してデータを取得するには、
python-fitbit
という便利なクライアントがあるので、これを使えばOK。
準備と実装
環境
| 項目 | バージョン |
|---|---|
| Ubuntu | 18.04 |
| python | 3.7 |
流れ
- python-fitbitをgitからclone
-
python gather_keys_oauth2.py <client_id> <client_secret>を実行してaccess_token/refresh_tokenを得る -
pip install fitbitして、クライアント初期化、データを取得する処理を書く
クライアントの初期化
from pprint import pprint
import pandas as pd
import numpy as np
import matplotlib.pyplot as plt
import seaborn as sns
import fitbit

client_id = '<Developerサイトから取得した情報>'
client_secret = '<Developerサイトから取得した情報>'
access_token = '<gather_keys_oauth2から取得した情報>'
refresh_token = '<gather_keys_oauth2から取得した情報>'

fitbit_client = fitbit.Fitbit(client_id, client_secret,
                             access_token=access_token,
                             refresh_token=refresh_token
                             )
心拍数のデータを取得
heart_daily = fitbit_client.time_series('activities/heart',
                          base_date= '2019-01-01',
                          end_date= '2021-07-22')
pprint(heart_daily['activities-heart'][300])
出力結果は以下のようなJSON。restingHeartRateが欲しい情報。
{'dateTime': '2019-10-28',
 'value': {'customHeartRateZones': [],
           'heartRateZones': [{'caloriesOut': 569.74105,
                               'max': 88,
                               'min': 30,
                               'minutes': 428,
                               'name': 'Out of Range'},
                              {'caloriesOut': 1390.3579,
                               'max': 123,
                               'min': 88,
                               'minutes': 396,
                               'name': 'Fat Burn'},
                              {'caloriesOut': 26.45791,
                               'max': 149,
                               'min': 123,
                               'minutes': 3,
                               'name': 'Cardio'},
                              {'caloriesOut': 9.90854,
                               'max': 220,
                               'min': 149,
                               'minutes': 1,
                               'name': 'Peak'}],
           'restingHeartRate': 71}}
安静時心拍数を抽出してグラフに表示
record = []
for dd in daily_data['activities-heart']:
    date_time = dd['dateTime']
    resting_heart_rate = dd['value'].get('restingHeartRate')
    if resting_heart_rate is not None:
        record.append([date_time, resting_heart_rate])

df = pd.DataFrame(record)
df.columns = ['date', 'heart_rate']
df['date'] = pd.to_datetime(df['date'])
df.index = df['date']
df['heart_rate'].plot(figsize=(15,6))
- 80を下回っているので正常値
- 上下20ポイントは開きがあって、ボラティリティの高い時期と安定期とがありそう
- 2020年5月以降のボラが小さい、在宅ワーク特性か
- 仕事が忙しい時とそうでない時の差が数値として出ているかもしれない
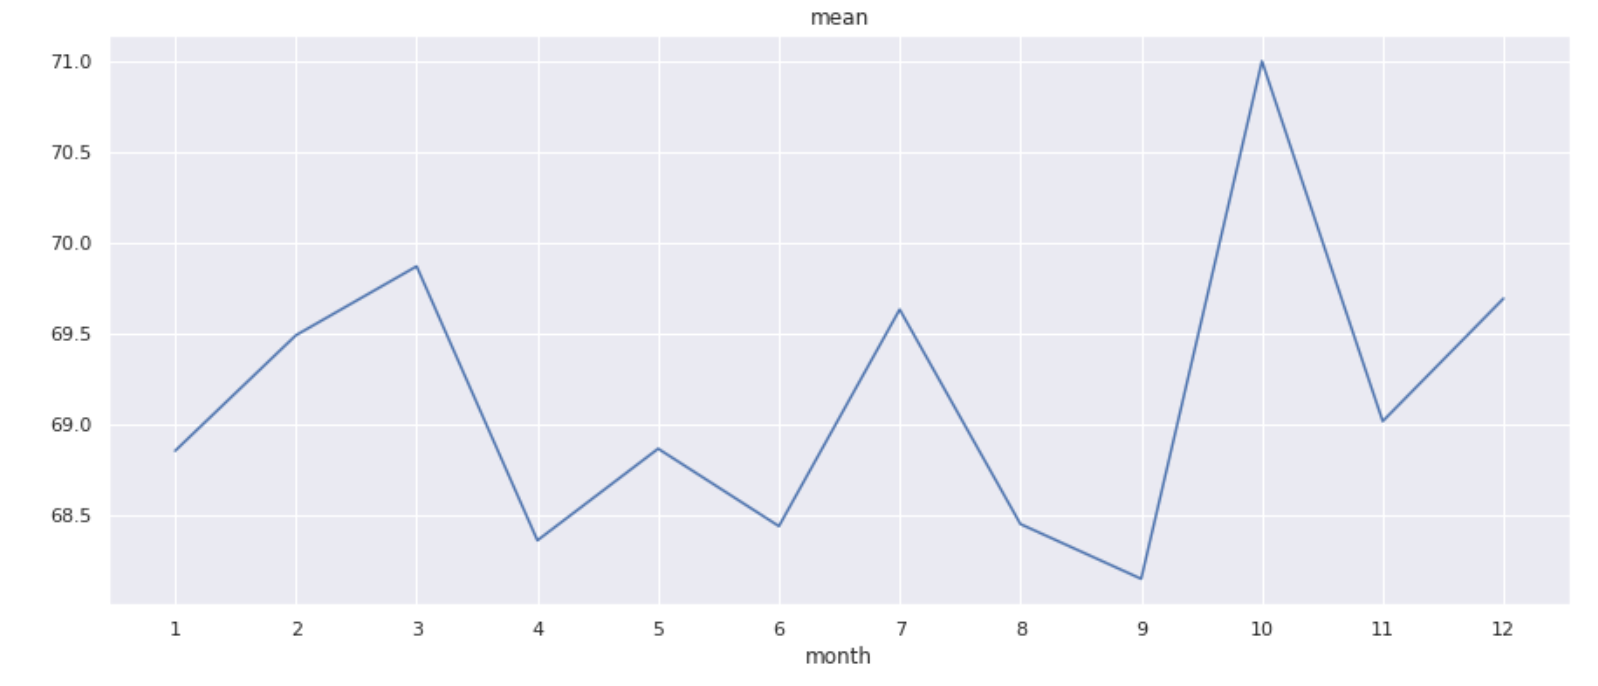
月次で平均をとって集計してみる
df_res.groupby('month').mean()['heart_rate'].plot(figsize=(15,6), title='mean', xticks=list(range(1, 13, 1)))
```

* 3月と7月と10月に変曲点がある
* もしかしたら・・・
* 3月:プロジェクトの納期に向けて、4月以降のプロジェクト開始に向けて慌ただしい時期
* 7月:1Qを過ぎて2Qから徐々に業績面で厳しく追Qされ・・・
* 10月:下期の開始には例年の如く大きなプロジェクトが始まる!
## 月次で標準偏差をとって集計してみる
```python
df_res.groupby('month').std()['heart_rate'].plot(figsize=(15,6), title='std', xticks=list(range(1, 13, 1)))
```

* 6月と10月に変曲点がある
* もしかしたら・・・
* 6月に心拍がアップダウンして7月に心拍数平均の凸を迎えていたのか?
* 10月は期待と不安で心拍数平均も最高潮!!
# まとめ
自分のデータだけあって、振り返りやすい、想像力が働く、という点は興味深いところです。
解釈の仕方について、論文など漁ってみると理解が深まりそう。
引き続き、オレオレデータで自分ハック・攻略に挑戦していきたいと思います。
> 階差の相関もとってみたい

