AWSの構成図をPythonパッケージのdiagramsを使って書こうと思ったのですが、意外と導入でつまずいたのでまとめます。
環境
- Python 3.8.10
- pip 23.3.1
- Windows 11 Pro
- WSL 2.1.5.0
描画用プログラム
from diagrams import Diagram
from diagrams.aws.compute import EC2
from diagrams.onprem.client import Client

with Diagram("Simple Diagram") as diag:
    ec2_pub = EC2('Public Instance')
    ec2_pri = EC2('Private Instance')
    Client() >> ec2_pub
    ec2_pub - ec2_pri

diag
中身は何でもいいのですが、ひとまず描画できることを確認するためのものです。
導入手順
$ pip install diagrams
どうやら大抵の人はこれで動くらしいですが、この後上記描画用プログラムを実行すると自分は以下のエラー発生。
failed to execute PosixPath('dot'), make sure the Graphviz executables are on your systems' PATH
dot コマンドがないってよ。
$ dot -V

Command 'dot' not found, but can be installed with:

sudo apt install graphviz
確かに無いので、おとなしく言われた通りインストールしてみます。
$ sudo apt install graphviz
確認
$ dot -V
dot - graphviz version 2.43.0 (0)
無事インストールできたので、ここで改めて上記描画プログラムを実行します。
No such file or directory: 'xdg-open'
またエラー。。。
$ xdg-open

Command 'xdg-open' not found, but can be installed with:

sudo apt install xdg-utils
はい、こちらも入れましょう。
$ sudo apt install xdg-utils
$ xdg-open --version
xdg-open 1.1.3
改めて描画プログラムを実行します。
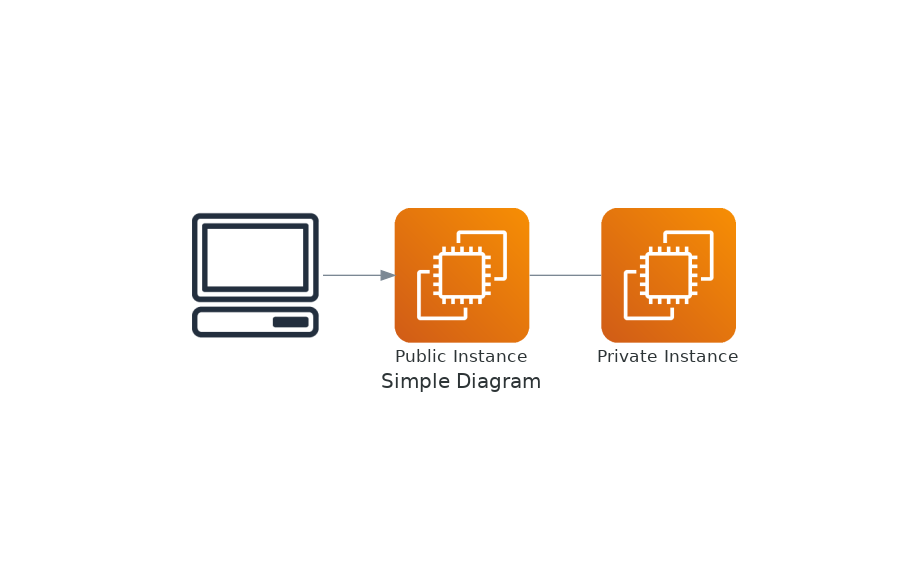
できた!
導入でつまずくと何をしようとしていたのか忘れる...