株式データを取得し、matplotlibで表示
ライブラリのインポート
いつものように必要なライブラリをインポートします。
from lxml.html import parse
from urllib.request import urlopen
import pandas as pd
import matplotlib.pyplot as plt
import string
import re
from pandas import DataFrame
from pandas.io.parsers import TextParser
python2ではurllib.requestではなくurllib2です。
urlからサイト情報の取得
取得方法は以下になります。
parsed = parse(urlopen('https://stocks.finance.yahoo.co.jp/stocks/history/?code=1570.T'))
doc = parsed.getroot()
まずは、urlopen()で取得したいページを指定し、parse()でそのページをパースします。
続いて、getroot()でルートとなるノードを取得します。
この流れはファイルなどの解析でも定番の流れなので覚えておくと便利です。
取得したドキュメントから株式情報を取り出す
tables = doc.findall('.//table')
calls = tables[1]
findall()を使って株式データが記録されているデータのテーブルをを取り出します。
テーブルの情報を読み出していく上で必要な関数を定義します。
参考文献[1]からの引用
def _unpack(row, kind='td'):
elts = row.findall('.//%s' % kind)
return [val.text_content() for val in elts]
>```python
def parse_options_data(table):
    rows = table.findall('.//tr')
    header = _unpack(rows[0], kind='th')
    data = [_unpack(r) for r in rows[1:]]
    return TextParser(data, names=header).get_chunk()
上述の関数を使ってデータを読み出していきます。
ここで、インデックスを時系列順に並び変えた状態で表示するためにreset_index()を用います。
calls_data.iloc[::-1]により逆順に並び替え、reset_index()によりインデックスを振り直しています。
reset_index()はインデックスを振り直す関数でありreset_index(drop=True)とするとにより元々のインデックス列を消去します。
calls_data = parse_options_data(calls)
calls_data2 = calls_data.iloc[::-1].reset_index(drop=True)

# print(calls_data2)
'''
	日付	           始値	  高値	 安値	   終値	  出来高	      調整後終値*
0	2017年9月29日	16,610	16,700	16,560	16,650	4,073,463	16,650
1	2017年10月2日	16,740	16,770	16,690	16,760	3,106,816	16,760
2	2017年10月3日	16,860	17,140	16,820	17,120	6,525,809	17,120
3	2017年10月4日	17,170	17,230	17,070	17,140	5,417,610	17,140
4	2017年10月5日	17,170	17,190	17,090	17,150	3,542,774	17,150
5	2017年10月6日	17,260	17,290	17,190	17,250	3,075,106	17,250
6	2017年10月10日	17,200	17,460	17,180	17,450	3,820,090	17,450
7	2017年10月11日	17,420	17,600	17,400	17,550	3,737,587	17,550
8	2017年10月12日	17,700	17,730	17,620	17,680	4,153,253	17,680
9	2017年10月13日	17,670	18,110	17,630	18,040	7,215,394	18,040
10	2017年10月16日	18,130	18,350	18,070	18,210	5,615,892	18,210
11	2017年10月17日	18,380	18,430	18,140	18,350	7,059,034	18,350
12	2017年10月18日	18,390	18,460	18,290	18,390	4,002,389	18,390
13	2017年10月19日	18,530	18,610	18,400	18,530	5,226,126	18,530
14	2017年10月20日	18,400	18,600	18,370	18,520	5,312,583	18,520
15	2017年10月23日	18,980	19,000	18,800	18,950	7,695,544	18,950
16	2017年10月24日	18,880	19,150	18,850	19,150	6,304,942	19,150
17	2017年10月25日	19,330	19,350	18,860	19,000	9,746,906	19,000
18	2017年10月26日	18,980	19,110	18,950	19,030	5,165,178	19,030
19	2017年10月27日	19,230	19,520	19,160	19,510	8,236,187	19,510
'''
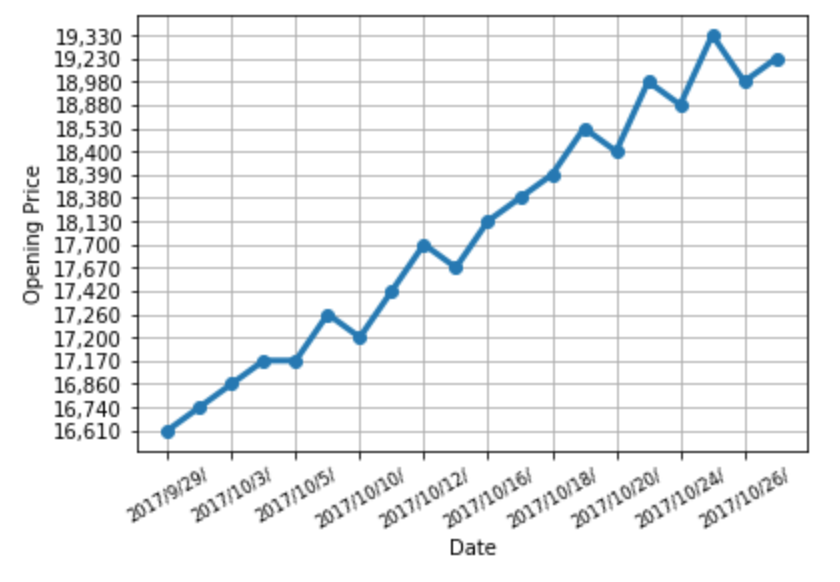
matplotlibで表示
matplotlibで表示するためには以下のようにします。
labels = []
for date in calls_data2.iloc[::2, 0]:
    labels.append(re.sub(u'[一-龥]', '/', str(date)))

# print(labels)
'''
['2017/9/29/', '2017/10/3/', '2017/10/5/', '2017/10/10/', '2017/10/12/',
 '2017/10/16/', '2017/10/18/', '2017/10/20/', '2017/10/24/', '2017/10/26/']
'''

fig = plt.figure()
ax = fig.add_subplot(1,1,1)
ax.plot(calls_data2.iloc[:, 1], 'o-', linewidth=3)

ax.set_xticks([0, 2, 4, 6, 8, 10, 12, 14, 16, 18])
ax.set_xticklabels(labels, rotation=30, fontsize='small')
ax.set_xlabel('Date')
ax.set_ylabel('Opening Price')
ax.grid(True)
plt.show()
labelsはser_xtickslabelsで使うので用意しています。
正規表現を用いて、例えば2017年9月29日というものを2017/9/29という風に置き換えています。
pythonでの漢字の正規表現はu'[一-龥]'ですが、あまり使うことはないと思います。
ax.set_xticks([0, 2, 4, 6, 8, 10, 12, 14, 16, 18])
ax.set_xticklabels(columns, rotation=30, fontsize='small')
のようにすることでデータ間隔に対応したラベルを出力することができます。
参考文献
[1]Pythonによるデータ分析入門
――NumPy、pandasを使ったデータ処理 https://www.oreilly.co.jp/books/9784873116556/