まずは普通のソート
ご存知argsortをつかった普通のソート。
test_sort.py
import numpy as np
import matplotlib.pyplot as plt

# Prepare test array
np.random.seed(20190823)
array1d = np.random.random(size=100) # 1d array with random value

# Usual sort
sort_ind = np.argsort(array1d) # index array for sort of array1d
sorted_array1d = array1d[sort_ind] # sorted array1d

# Plot results #1
plt.figure()
plt.plot(array1d, label='Random', c='k')
plt.plot(sorted_array1d, label='Sorted')
plt.legend()
plt.show()
ソートしたあと元に戻す
果たして自分以外に需要があるのか。
test_sort.py(のつづき1)
# Re-sort
re_sort_ind = np.argsort(sort_ind) # index array for sort of sort_ind

# Plot results #2
plt.figure()
plt.plot(array1d, label='Random', c='k')
plt.plot(sorted_array1d, label='Sorted')
plt.plot(sorted_array1d[re_sort_ind], zorder=-2, label='Re-sorted', lw=5, c='gold')
plt.legend()
plt.show()
Matplotlibによる表示。もとの配列(黒)とソート後に戻した配列(黄)がちゃんと一致している。

第1列、第2列の優先順にソートしたい
日本語が難しいですね。
以下を見ていただいたほうが早いかと。
test_sort.py(のつづき2)
# Prepare test array
np.random.seed(20190823)
array2d = np.random.randint(0,5,size=(100,2)) # 2d array with random value

# Plot results #3
plt.figure()
plt.plot(array2d[:,0], label='1st column')
plt.plot(array2d[:,1], label='2nd column')
plt.title('Before sort')
plt.legend()
plt.show()
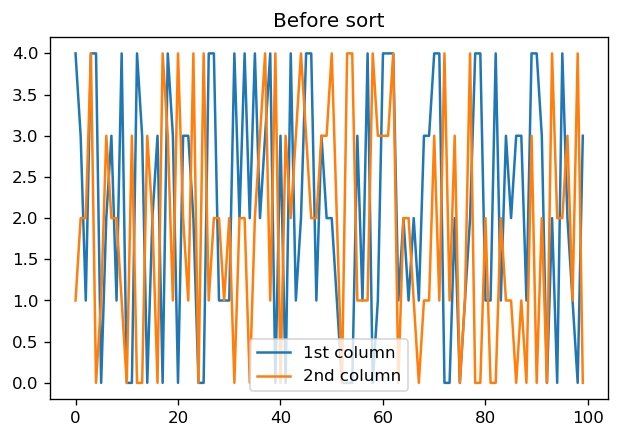
100行2列のテスト配列について、各列ごとにプロット。

醜いのでさっさとソートしましょう。
test_sort.py(のつづき2)
from operator import itemgetter

# Sort!
list2d = list(array2d)
sorted_list2d = sorted(list2d, key=itemgetter(0,1))
sorted_array2d = np.array(sorted_list2d)

# Plot results #4
plt.figure(dpi=120)
plt.plot(sorted_array2d[:,0], label='1st column')
plt.plot(sorted_array2d[:,1], label='2nd column')
plt.title('After sort')
plt.legend()
plt.show()
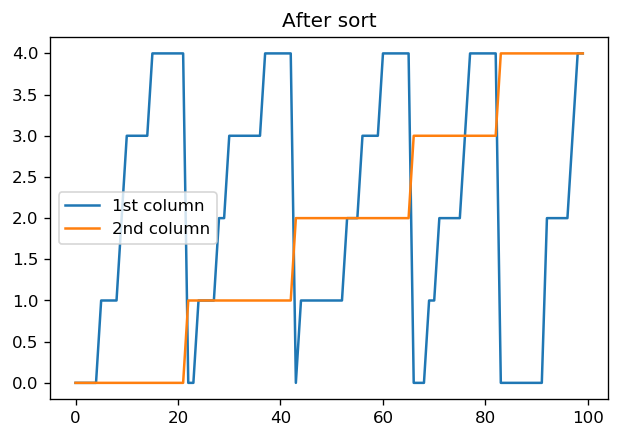
第1列の値(青)についてソートされており、第1列の値が同じ場合は第2列(橙)の値に従ってソートされていることが分かります。
itemgetterを使うためにnumpyの配列からlistに変換し、再度numpy配列へと変換しています。手間はかかりますが、短く単純に書けるという意味で便利かと思います。
もちろん、
sorted_list2d = sorted(list2d, key=itemgetter(0,1))
のitemgetterの引数を変えることで指定する列、順番を自由に指定できます。
test_sort.py(のつづき3)
# Sort!
sorted_list2d = sorted(list2d, key=itemgetter(1,0))
sorted_array2d = np.array(sorted_list2d)

# Plot results #5
plt.figure(dpi=120)
plt.plot(sorted_array2d[:,0], label='1st column')
plt.plot(sorted_array2d[:,1], label='2nd column')
plt.title('After sort')
plt.legend()
plt.show()
先ほどとは逆に、第2列の値(橙)についてソートされており、第2列の値が同じ場合は第1列(青)の値に従ってソートされていることが分かります。
それでは良いソートライフを。


