目的/ゴール
matplotlibで作成した円グラフを、DjangoのWebページに乗せる
背景
現在、DjangoとHerokuで家計簿アプリ作成を試みており、円グラフでdashboard的に情報を見せたいと考えている。
しかし、Djangoで棒グラフを書く方法は様々な記事で紹介されているが、円グラフについては情報が少ない。。。
試行錯誤の末、なんとか円グラフをDjangoで表示できたので、メモを残しておく
※一部ソースコードを修正して簡略化いるので、パッケージとかで抜けているところがあるかも。。。
準備
matplotlibをインストールする
pip3 install matplotlib
Django
urls.py
画像を表示するインデックスページと、画像のURLを指定
urls.py
urlpatterns = [
    url(r'^$', views.index, name='index'),
    url(r'^charts/simple.png$', views.simple,name="charts"),
]
views.py
indexとsimpleを用意
views.py
# coding:utf-8
from django.http import HttpResponse
from django.shortcuts import render

def index(request):
    return render(request, 'gas/fig.html',output)

def simple(request):
    import django
    from matplotlib.backends.backend_agg import FigureCanvasAgg as FigureCanvas
    import matplotlib.pyplot as plt
    # prepare for data
    datas = [20, 30, 10]
    labels = ['Wine', 'Sake', 'Beer']
    colors = ['yellow', 'red', 'green']
    # create figure
    fig = plt.figure(1,figsize=(4,4))
    ax = fig.add_subplot(111)
    ax.axis("equal")
    pie = ax.pie(datas, #データ
                 startangle=90, #円グラフ開始軸を指定
                 labels=labels, #ラベル
                 autopct="%1.1f%%",#パーセント表示
                 colors=colors, #色指定
                 counterclock=False, #逆時計回り
                 )
    # Return
    canvas=FigureCanvas(fig)
    response=django.http.HttpResponse(content_type='image/png')
    canvas.print_png(response)
    return response
html
templateを用意。imgタグでsimpleのURLを叩く
index.html
<!doctype html>
<html lang="en">
  <head>
    <title>hello</title>
  </head>

  <body>
    <img src="/gas/charts/simple2.png" alt="">
  </body>
</html>
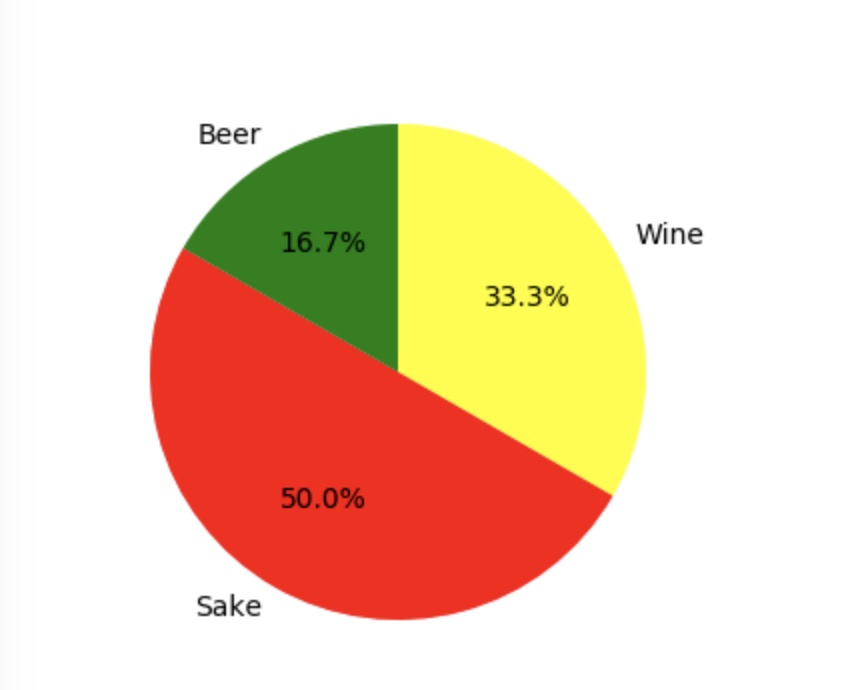
結果
こんな感じ。無事、円グラフ出力成功!
Link