はじめに
今回は、新型コロナウィルスの第6波の予測を、SIRモデルを用いながらしたいと思います。
必要なモジュール
プログラムコードは、python
import numpy as np
import matplotlib.pyplot as plt
import matplotlib
%matplotlib inline
import pandas as pd
plt.rcParams['font.family'] = 'Hiragino Sans'
import datetime
データセット
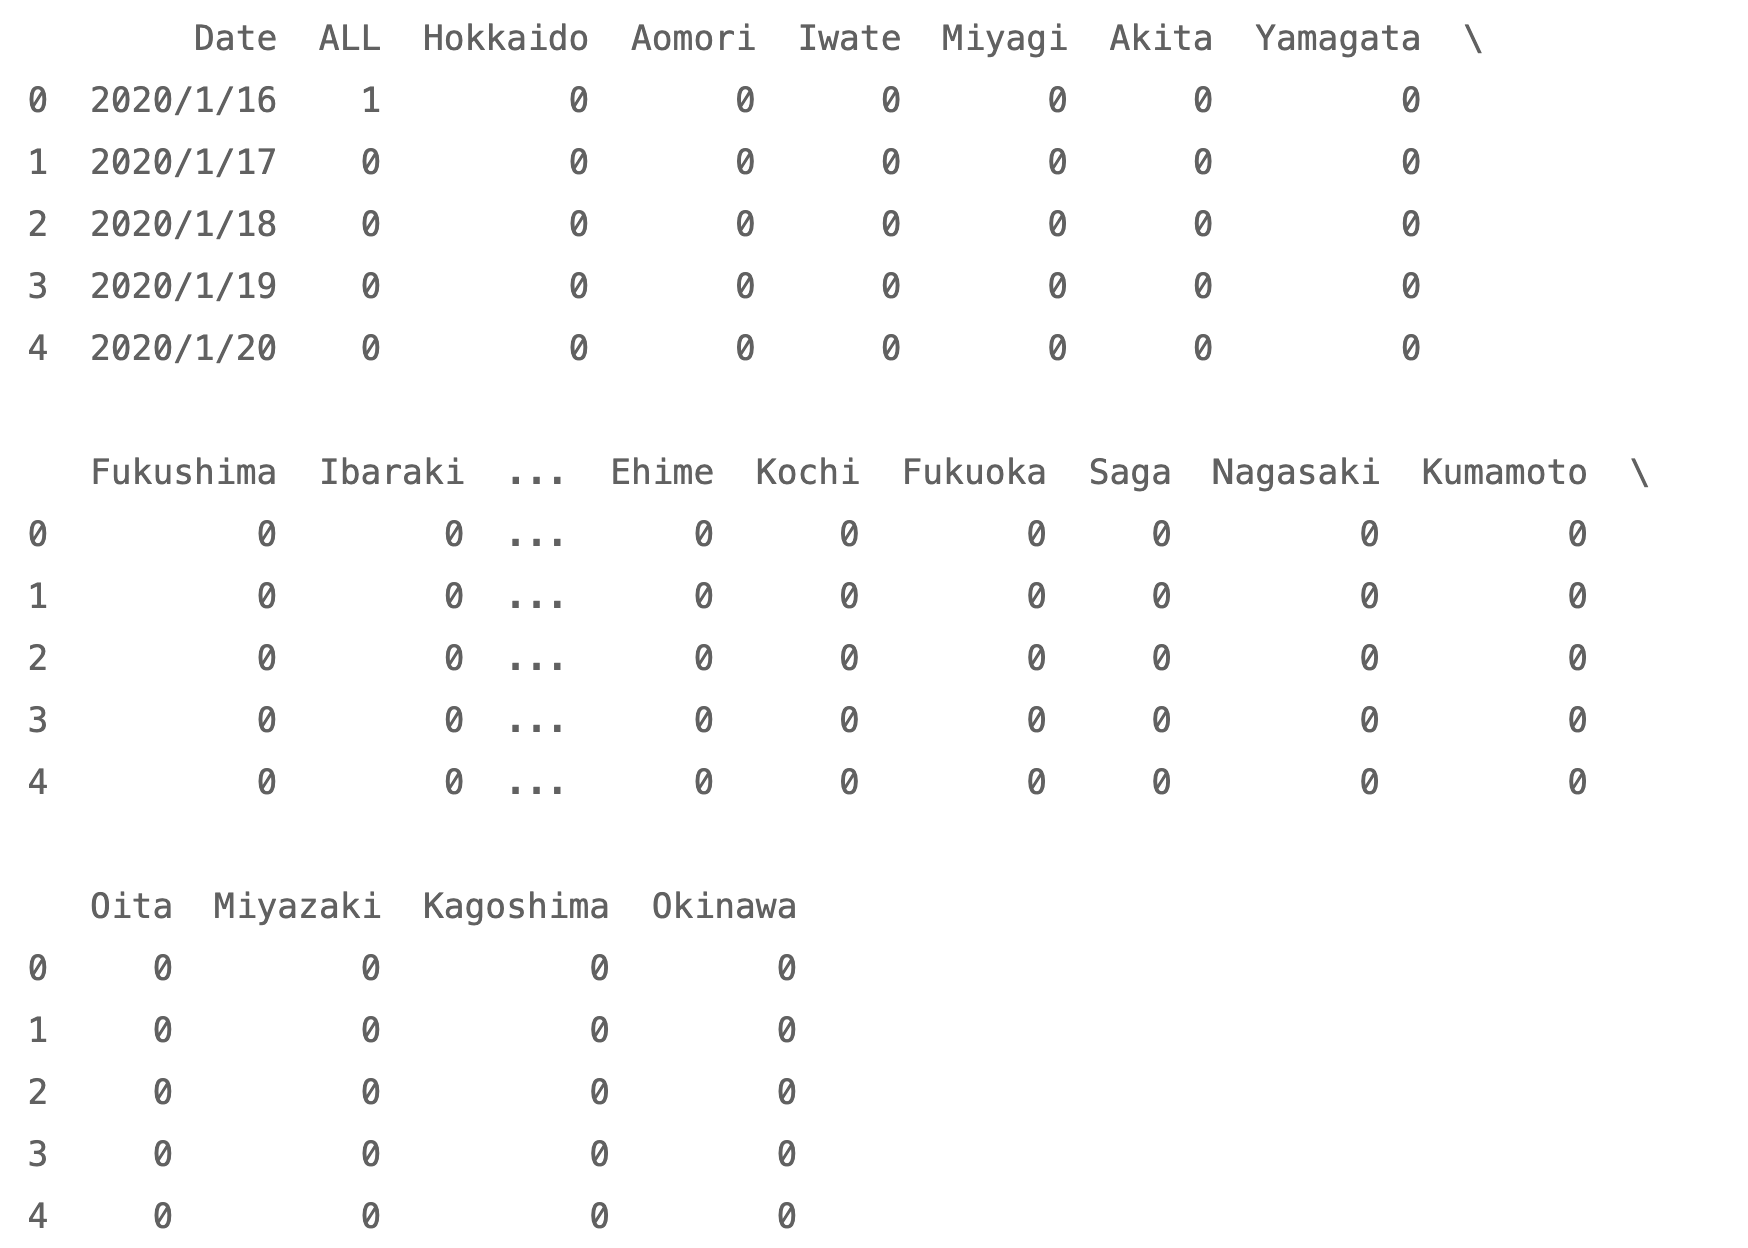
厚生労働省のサイトの「新規陽性者数の推移(日別)」よりダウンロードし、第6波生データ.csvとファイル名を変更した。
df = pd.read_csv('第6波生データ.csv', header=0)
df.head()
表の可視化
大阪府
osaka = df[['Date','Osaka']]
osaka.head()

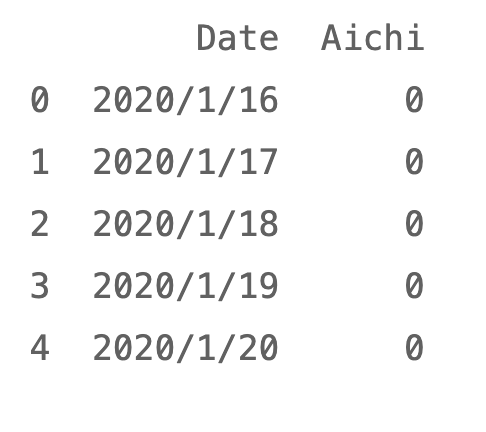
愛知県
aichi = df[['Date','Aichi']]
aichi.head()
愛知県、京都府、大阪府
aichikyotoosaka = df[['Date','Aichi','Kyoto','Osaka']]
aichikyotoosaka.head()

グラフによる可視化
大阪府
plt.bar(np.arange(osaka['Date'].size), osaka['Osaka'].values)
plt.xlabel("コロナの日数")
plt.ylabel("新規感染者数")
plt.title('大阪府新規感染者数推移')

愛知県
plt.bar(np.arange(aichi['Date'].size), aichi['Aichi'].values)
plt.xlabel('コロナの日数')
plt.ylabel('新規感染者数')
plt.title ('愛知県新規感染者数推移')

第6波の抽出
図より700日後からを第6波とした。
infected=osaka[700:]["Osaka"].values
plt.bar(np.arange(infected.size), infected)

infected=aichi[700:]["Aichi"].values
plt.bar(np.arange(infected.size), infected)

予測モデル
今回は、SIRモデルを用いた。
図はこのサイトより引用。


def SIR_function (sir, t, beta, gamma):
    s,i,r=sir
    ds_dt=-beta*s*i/N
    di_dt=beta*s*i/N-gamma*i
    dr_dt=gamma*i
    return np.array([ds_dt,di_dt,dr_dt])
大阪府の予測
$N$に大阪府の人口、$\beta,\gamma$は適当な値で予測。
N=8850000
beta0,gamma0=0.056,0.045
predict_times=np.arange(200)
times=np.arange(infected.size)

r0=osaka[:700]["Osaka"].values.sum()
i0=infected[0]
sir0=(N-r0+i0,i0,r0)

from scipy.integrate import odeint

predict=odeint(SIR_function,sir0,predict_times,args=(beta0,gamma0))
i=predict[:, 1]

plt.bar(times,infected,label="actual")
plt.plot(predict_times,i,label="predicted", color='orange')
plt.legend()
当然ながらうまく予測できない。

そこで、scipyのcurve_fitを用いて、$\beta,\gamma$の最適値を求める。
from scipy.optimize import curve_fit

def return_infected (t, beta, gamma):
    predict=odeint(SIR_function,sir0,t,args=(beta,gamma))
    i=predict[:, 1]
    return i

best_params, cov=curve_fit(return_infected, times, infected, (beta0, gamma0), bounds=((0, 0,), (5, 5)))
$\beta=4.99999999,\gamma=4.68203601$が最適値であると算出された。
best_params = array([4.99999999, 4.68203601])

best_beta, best_gamma = best_params
predict=odeint(SIR_function,sir0,predict_times,args=(best_beta,best_gamma))
predict_infected=predict[:, 1]

plt.bar(times,infected,label="actual")
plt.plot(predict_times,predict_infected,label="predicted", color='orange')
plt.legend()
良い当てはまり具合だと言える。

横軸を日付に変更
startdate = osaka[('Date')][700]

startdate

startdatetime = datetime.datetime.strptime(startdate,'%Y/%m/%d').date()
predict_datetimes = [startdatetime + datetime.timedelta(days=int(day)) for day in predict_times]
predict_datetimes
best_beta, best_gamma = best_params
predict=odeint(SIR_function,sir0,predict_times,args=(best_beta,best_gamma))
predict_infected=predict[:, 1]

plt.bar(predict_datetimes[:times.size],infected,label="actual")
plt.plot(predict_datetimes,predict_infected,label="predicted", color='orange')
plt.legend()
plt.xticks(rotation=90)

終わりに
筆者が、予測をした際は1月23日であった。その時の、大阪府の新規感染者数は6217人だった。このSIRモデルによると、大阪府の新規感染者数は、2月にピークを迎える。どんどん増え続けている新規感染者数であるが、2月には減少傾向を迎えるだろう。よって、SIRモデルがコロナの新規感染者数を予測するのに、重要なモデルであることを熟知した。これからは、日本国民の3回目のワクチン接種が進めば、第7波は防ぐことができるであろう。