環境構築編の続きです。
MVCモデルを用いて書いていきます。
目次
modelの作成
modelは、データベースからデータを取得したりするところです。
1、「C:\xamppl\htdocs\test_app\application\models」に作っていきます。
ファイル名は~_modelとしましょう。
今回はhomeを作るのでhome_model.phpとしました。
<?php
class Home_model extends CI_Model
{
        public function __construct()
        {
                $this->load->database();
        }
}
上記のプログラムは、基本形になりますのでclass名だけ変更してコピペで大丈夫です。
2、実際にデータベースからデータを取得するプログラムを書いていきます。
<?php
class Home_model extends CI_Model
{
        # public function __construct(){}の下

        #指定した場所のデータを取得する
	public function get_point_data($place)
	{
		try{
			$this->db->where('place' , $place);
			$query=$this->db->get("hoge");
		} catch(Exception $e){
			echo ' 捕捉した例外:', $e-> getMessage(), "\n";
		}
		return $query->result_array();
	}
}
プログラムの説明をしていきます。this->db->whereでwhere文のクエリを作成しています。複数条件にしたい場合は、その下にthis->db->whereを付け加えていけば追加されていきます。詳しくは「ここ」を見てください。
this->db->get('テーブル名')でデータを取得します。
これで、modelの完成です。
controllerの作成
controllerでは、modelで取得したデータをviewに渡したり、データを使いに計算したりなど、いろいろなことを行う場所です。
「C:\xamppl\htdocs\test_app\application\controllers」に作っていきます。
ファイル名は~としましょう。このファイル名がurlとして使われます。
また、ファイル名がをhomeとしたら、class名はHomeです。
因みに、私はrailsの感覚でhome_controllerとつけ失敗しました。
<?php
class Home extends CI_Controller
{
	public function __construct()
	{
		parent::__construct();
		//モデルの読み込み
		$this->load->model('home_model');
	}

	public function index()
	{
		//モデル内のメソッド"get_point_data"を実行し、値をもらう
		$data['point_data'] = $this->home_model->get_point_data('新潟');
		//view('view名',渡すデータ)
		$this->load->view("home" , $data);
	}
}
プログラムの説明をしていきます。this->loda->model()でモデルの読み込みを行っています。this->load->view()で開きたいviewとdataを渡します。ここで、大切なのが渡したいデータは全部このdataに入れることです。この取り出し方はviewで説明します。感覚で進めていきここで、かなり時間がかかりました。
これで、controllerの完成です。
viewの作成
「C:\xamppl\htdocs\test_app\application\views」に作っていきます。
ファイル名は~としましょう。viewの名前はcontrollerの名前とかぶっていても問題ありません。
<!DOCTYPE html>
<html lang="ja">
<head>
<?php

$dataPoints = array(
    array("label"=> 1992, "y"=>105),
    array("label"=> 1993, "y"=>130),
    array("label"=> 1994, "y"=>158),
    array("label"=> 1995, "y"=>192),
    array("label"=> 1996, "y"=>309),
    array("label"=> 1997, "y"=>422),
    array("label"=> 1998, "y"=>566),
    array("label"=> 1999, "y"=>807),
    array("label"=> 2000, "y"=>1250),
    array("label"=> 2001, "y"=>1615),
    array("label"=> 2002, "y"=>2069),
    array("label"=> 2003, "y"=>2635),
    array("label"=> 2004, "y"=>3723),
    array("label"=> 2005, "y"=>5112),
    array("label"=> 2006, "y"=>6660),
    array("label"=> 2007, "y"=>9183),
    array("label"=> 2008, "y"=>15844),
    array("label"=> 2009, "y"=>23185),
    array("label"=> 2010, "y"=>40336),
    array("label"=> 2011, "y"=>70469),
    array("label"=> 2012, "y"=>100504),
    array("label"=> 2013, "y"=>138856),
    array("label"=> 2014, "y"=>178391),
    array("label"=> 2015, "y"=>229300),
    array("label"=> 2016, "y"=>302300),
    array("label"=> 2017, "y"=>368000)
);

?>
<!DOCTYPE HTML>
<html>
<head>
<script>
window.onload = function () {

var chart = new CanvasJS.Chart("chartContainer", {
    animationEnabled: true,
    theme: "light2",
    title:{
        text: "Exponential Growth of Global Solar PV "
    },
    axisY:{
        title: "Energy (in megawatt)",
        logarithmic: true,
        titleFontColor: "#6D78AD",
        gridColor: "#6D78AD",
        labelFormatter: addSymbols
    },
    axisY2:{
        title: "Energy (in megawatt)",
        titleFontColor: "#51CDA0",
        tickLength: 0,
        labelFormatter: addSymbols
    },
    legend: {
        cursor: "pointer",
        verticalAlign: "top",
        fontSize: 16,
        itemclick: toggleDataSeries
    },
    data: [{
        type: "line",
        markerSize: 0,
        showInLegend: true,
        name: "Log Scale",
        yValueFormatString: "#,##0 MW",
        dataPoints: <?php echo json_encode($dataPoints, JSON_NUMERIC_CHECK); ?>
    },
    {
        type: "line",
        markerSize: 0,
        axisYType: "secondary",
        showInLegend: true,
        name: "Linear Scale",
        yValueFormatString: "#,##0 MW",
        dataPoints: <?php echo json_encode($dataPoints, JSON_NUMERIC_CHECK); ?>
    }]
});
chart.render();

function addSymbols(e){
    var suffixes = ["", "K", "M", "B"];

    var order = Math.max(Math.floor(Math.log(e.value) / Math.log(1000)), 0);
    if(order > suffixes.length - 1)
        order = suffixes.length - 1;

    var suffix = suffixes[order];
    return CanvasJS.formatNumber(e.value / Math.pow(1000, order)) + suffix;
}

function toggleDataSeries(e){
    if (typeof(e.dataSeries.visible) === "undefined" || e.dataSeries.visible) {
        e.dataSeries.visible = false;
    }
    else{
        e.dataSeries.visible = true;
    }
    chart.render();
}

}
</script>
	<!-- Bootstrap core CSS -->
	 <?php $this->load->helper('url'); ?>
    <link href="<?php echo base_url("assets/css/bootstrap.min.css"); ?>" rel="stylesheet">
	<meta charset="utf-8">
	<title>test_app</title>
</head>

<body class="bg-light" >
	<header class="blog-header " >
      <div class="navbar navbar-dark bg-dark ">
        <div class="container text-center navbar-brand">
        	<strong>test_app</strong>
        </div>
      </div>
	 </header>

<main >
	<div class="container py-5">
		<div class="row">
			<div class="col-md-12 text-center">
				<!-- canvasjsで折れ線グラフの表示 -->
				<div id="chartContainer" style="height: 370px; width: 100%;"></div>
			<div class="col-md-12 text-center">
				<div class="card">
					<div class="card-body">
						<!-- canvasjsで折れ線グラフの表示 -->
						<div id="chartContainer" style="height: 370px; width: 100%;"></div>
						<h5 class="pt-2">気温</h5>
						<?php foreach ($point_data as $data) : ?>
                                <h6>新潟 : <?php echo $data['temp'] ?></h6>
                        <?php endforeach; ?>
					</div>
				</div>
			</div>
		</div>
	</div>
</main>
</body>
    <footer>
    <!-- Bootstrap core JavaScript
    ================================================== -->
    <!-- Placed at the end of the document so the pages load faster -->
	<script src="<?php echo base_url("assets/js/bootstrap.min.js"); ?>"></script>
	<script src="<?php echo base_url("assets/js/canvasjs.min.js"); ?>"></script>
	</footer>
</html>
プログラムの説明をしていきます。controllerで渡したデータの受け取り方はdataではなくpoint_dataとなります。<scriptのところでcanvasjsの設定を行っています。ここでは、サンプルコードをそのまま使っています。
これで、viewの完成です。
routesの設定
最後にroutesを設定しなくては表示することができません。
「C:\xamppl\htdocs\test_app\application\config 」のroutes.phpを下記のように編集します。
$route['default_controller'] = 'Home';
完成
それでは、完成したものを見てみましょう。xampp control panelを開き、ApacheとMySQlをstartさせた後に「http://localhost/test_app/home 」でみることができます。
設定がうまく行っていれば下の画面が表示されるはずです。
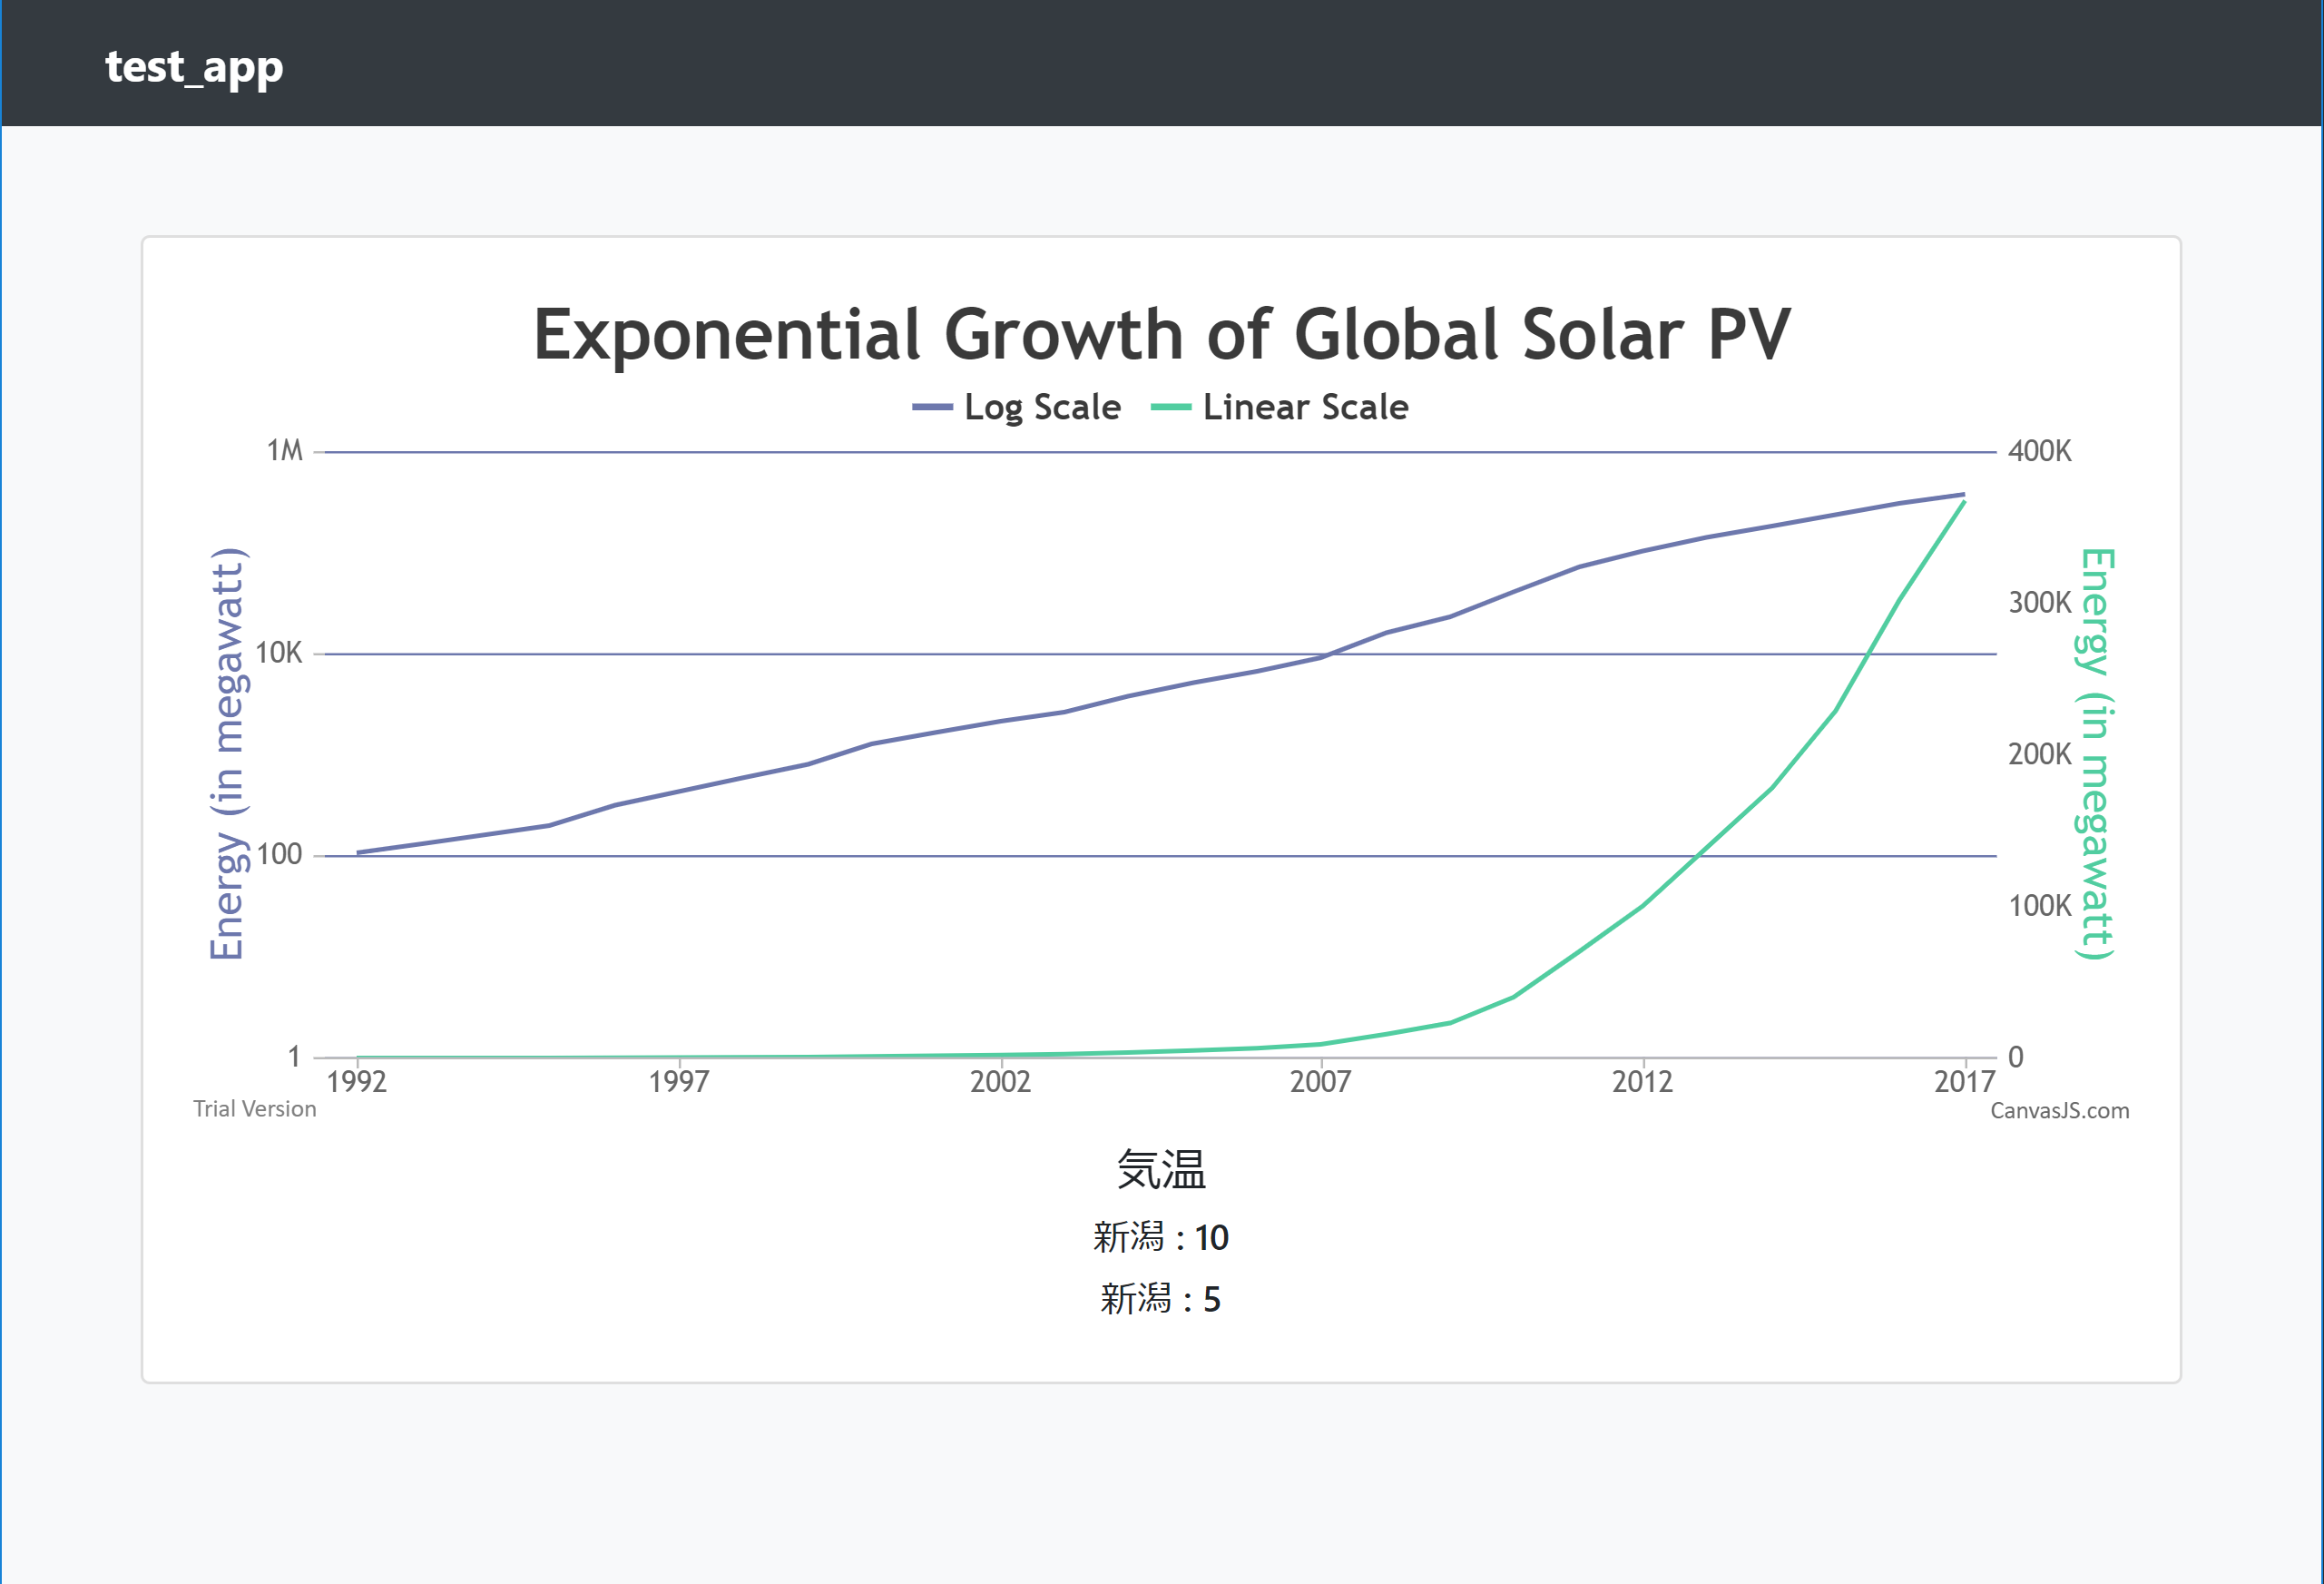
これで意味のわからないwebアプリケーションの完成です。
まとめ
bootstrapとcodeigniterを使ったアプリケーションが作ることができたので、デザイン的に良いものが簡単に実装できるようになりました。