Pythonでアラン分散計算
角速度センサをはじめとするMEMSセンサのノイズ,バイアス特性を知る場合,アラン分散というものが用いられます.
1時間静置する試験から取得したセンサー出力をCSVにまとめ,そこからアラン分散を計算します.
使用言語 python
使用モジュール allantools, pylab, numpy, pandas, csv
環境 windows 10 64bit
環境構築
以下のコマンドでアラン分散計算モジュールをインストールします.
python -m pip install AllanTools
スクリプト例
以下の例では,LOG00.TXTというカンマ区切りのテキストファイルに書き込まれた時系列のセンサー情報を読み取り,そこからアラン分散の計算を行います.
import allantools
import matplotlib.pyplot as plt
# import pylab as plt
import numpy as np
import pandas as pd
import csv

# グラフフォントの設定

col_names = ['a{0:02d}'.format(i) for i in range(15)]       #カラムの名前を指定することで,空データがある場合にもpandas読みこみできる
# txtファイル読み取り,pandas data frame形式に変換.ヘッダー無し,カラム名をcol_names(a0 ~ a15)に指定
df = pd.read_table('LOG00031.TXT',sep=',',header=None, names=col_names)
print(df)
# 該当データの特定列のみ抽出する
sim_time = df.iloc[:,0]
gyro_x_df = df.iloc[:,6]
gyro_y_df = df.iloc[:,7]
gyro_z_df = df.iloc[:,8]
# df(データフレーム形式)からリスト形式に変換
gyro_x = gyro_x_df.values.tolist()
gyro_y = gyro_y_df.values.tolist()
gyro_z = gyro_z_df.values.tolist()
# plt.plot(sim_time, gyro_x)

# -------------------------
# アラン分散計算
# -------------------------
# numpy logspaceではログスケールに均等な配列生成をする
# np.logspace(開始点,終了点,要素数,基数)
t = np.logspace(0, 4, 100)
# y = allantools.noise.white(10000)  # Generate some frequency data
r = 30 # sample rate in Hz of the input data
(t2_x, ad_x, ade, adn) = allantools.mdev(gyro_x, rate=r, data_type="freq", taus=t)  # Compute the overlapping ADEV
(t2_y, ad_y, ade, adn) = allantools.mdev(gyro_y, rate=r, data_type="freq", taus=t)  # Compute the overlapping ADEV
(t2_z, ad_z, ade, adn) = allantools.mdev(gyro_z, rate=r, data_type="freq", taus=t)  # Compute the overlapping ADEV
# fig = plt.loglog(t2, ad) # Plot the results


# plt.rcParams['text.usetex'] = True
# フォント指定
plt.rcParams['font.family'] = 'Times New Roman'

# figure()でグラフ表示領域を作る.figというオブジェクトを指定.
fig = plt.figure()
# plt.title('$f(x) = \sin(\pi x)$')
# プロットするグラフの位置指定(高さ2, 幅2, 象限)
ax1 = fig.add_subplot(2,2,1)
ax2 = fig.add_subplot(2,2,2)
ax3 = fig.add_subplot(2,2,3)
# ax4 = fig.add_subplot(2,2,4)

# グラフのプロット(今回はloglogグラフ)
ax1.loglog(t2_x,ad_x, color="black")
ax2.loglog(t2_y,ad_y, color="black")
ax3.loglog(t2_z,ad_z, color="black")
# ax4.loglog(t2,ad)
# グラフに目盛りを表示
ax1.grid(which='minor')
ax2.grid()
ax3.grid()
# グラフ範囲の設定
ax1.set_ylim([0.001,0.01])
ax2.set_ylim([0.0001,0.01])
ax3.set_ylim([0.0001,0.01])
# グラフタイトル
ax1.set_xlabel(r"$\tau$ [s]")
ax1.set_ylabel(r"Gyro X $\sigma(\tau)$ [deg/hr]") #LaTex形式で数式の記述
ax2.set_xlabel(r"$\tau$ [s]")
ax2.set_ylabel(r"Gyro Y $\sigma(\tau)$ [deg/hr]")
ax3.set_xlabel(r"$\tau$ [s]")
ax3.set_ylabel(r"Gyro Z $\sigma(\tau)$ [deg/hr]")

# グラフ表示
# plt.legend()#凡例表示
plt.show()
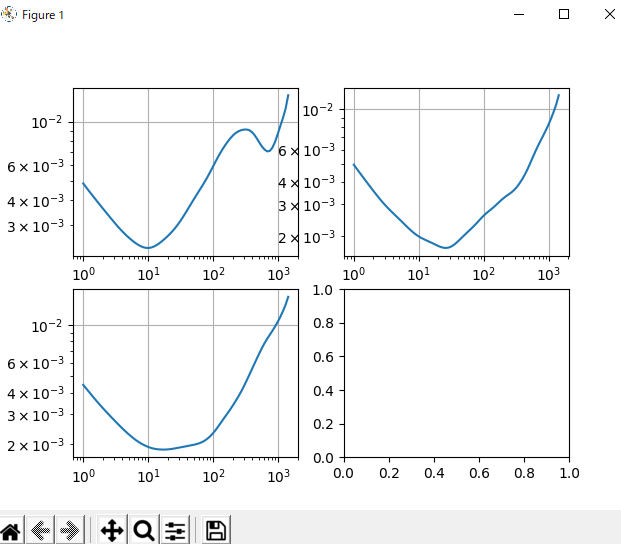
グラフ
3軸方向の角速度センサー出力のアラン分散です.
