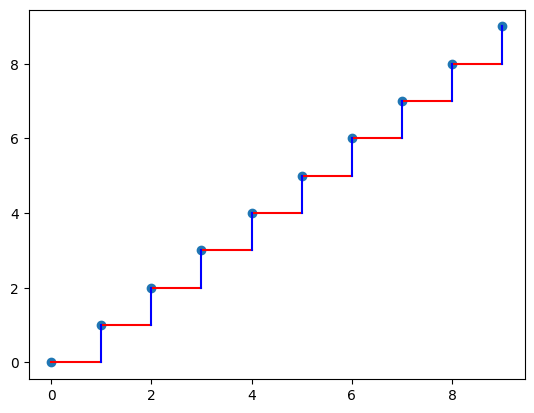
散布図を作成した時に、L1距離をプロットする方法がなかったので自作した
import numpy as np
import matplotlib.pyplot as plt

x_hoge = np.arange(10)
y_hoge = np.arange(10)

plt.scatter(x_hoge, y_hoge)

#plt.plot([x_start,x_end],[y_start,y_end])
for i in range(x_hoge.shape[0] - 1):
  plt.plot([x_hoge[i], x_hoge[i + 1]], [y_hoge[i], y_hoge[i]], c="red")

for i in range(y_hoge.shape[0] - 1):
  plt.plot([x_hoge[i + 1], x_hoge[i + 1]], [y_hoge[i], y_hoge[i + 1]],c="blue")
出力画像
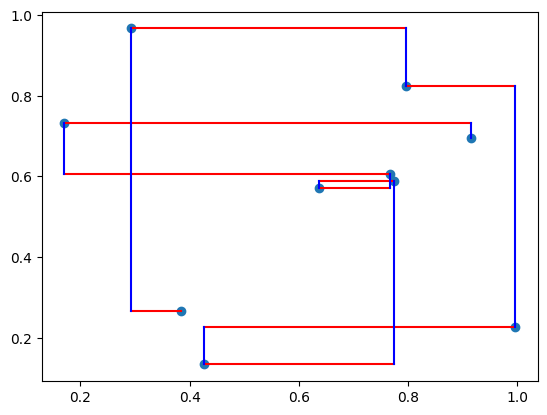
乱数にしたバージョン
x_hoge = np.random.rand(10)
y_hoge = np.random.rand(10)

plt.scatter(x_hoge, y_hoge)

#plt.plot([x_start,x_end],[y_start,y_end])
for i in range(x_hoge.shape[0] - 1):
  plt.plot([x_hoge[i], x_hoge[i + 1]], [y_hoge[i], y_hoge[i]], c="red")

for i in range(y_hoge.shape[0] - 1):
  plt.plot([x_hoge[i + 1], x_hoge[i + 1]], [y_hoge[i], y_hoge[i + 1]], c="blue")
出力画像
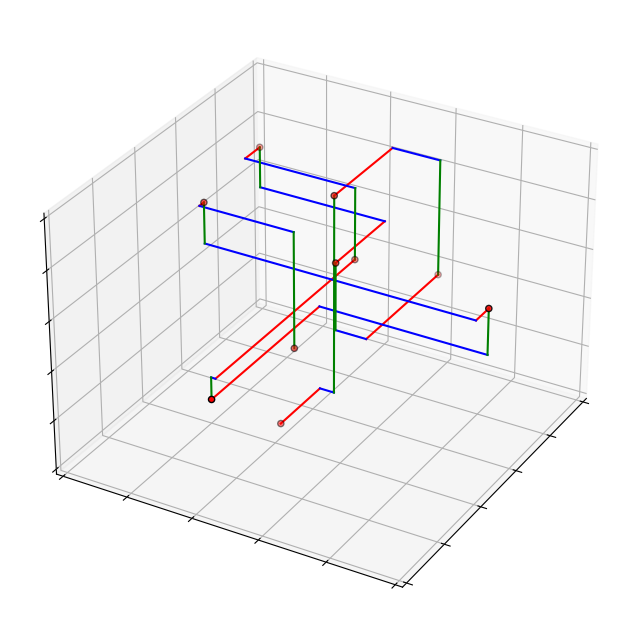
3Dplotバージョン
import numpy as np
import matplotlib.pyplot as plt
from mpl_toolkits.mplot3d import Axes3D
from matplotlib.animation import FuncAnimation


#データの作成
x_hoge = np.random.rand(10)
y_hoge = np.random.rand(10)
z_hoge = np.random.rand(10)


# figureを作成
fig = plt.figure(figsize = (8, 8))
ax = fig.add_subplot(111, projection='3d')

#figureの設定
ax.view_init(elev=30, azim=30)
ax.set_xlim([0, 1])
ax.set_ylim([0, 1])
ax.set_zlim([0, 1])
ax.tick_params(bottom=False, left=False, right=False, top=False)
ax.tick_params(labelbottom=False, labelleft=False, labelright=False, labeltop=False)


ax.scatter(x_hoge, y_hoge, z_hoge, color = "red",edgecolors='black')
#zx.plot([x_start, x_end], [y_start, y_end], [z_start, z_end])
for i in range(x_hoge.shape[0] - 1):
  ax.plot([x_hoge[i], x_hoge[i + 1]], [y_hoge[i], y_hoge[i]], [z_hoge[i] , z_hoge[i]], c="red")

for i in range(y_hoge.shape[0] - 1):
  ax.plot([x_hoge[i + 1], x_hoge[i + 1]], [y_hoge[i], y_hoge[i + 1]], [z_hoge[i] , z_hoge[i]], c="blue")

for i in range(y_hoge.shape[0] - 1):
  ax.plot([x_hoge[i + 1], x_hoge[i + 1]], [y_hoge[i + 1], y_hoge[i + 1]], [z_hoge[i] , z_hoge[i + 1]], c="green")

plt.show()
出力画像
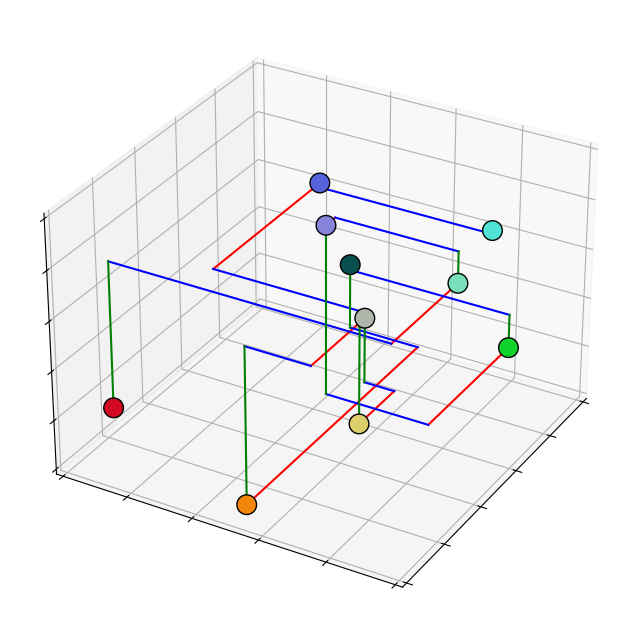
散布図を着色した場合
import numpy as np
import matplotlib.pyplot as plt
from mpl_toolkits.mplot3d import Axes3D
from matplotlib.animation import FuncAnimation


#データの作成
x_hoge = np.random.rand(10)
y_hoge = np.random.rand(10)
z_hoge = np.random.rand(10)

# figureを作成
fig = plt.figure(figsize = (8, 8))
ax = fig.add_subplot(111, projection='3d')

#figureの設定
ax.view_init(elev=30, azim=30)
ax.set_xlim([0, 1])
ax.set_ylim([0, 1])
ax.set_zlim([0, 1])
ax.tick_params(bottom=False, left=False, right=False, top=False)
ax.tick_params(labelbottom=False, labelleft=False, labelright=False, labeltop=False)

#カラーコードを作成
color_list = []
for i in range(x_hoge.shape[0]):
  R_16  = '{:02x}'.format(int(x_hoge[i] * 255), 'x')
  G_16  = '{:02x}'.format(int(y_hoge[i] * 255), 'x')
  B_16  = '{:02x}'.format(int(z_hoge[i] * 255), 'x')
  color_str ="#" + R_16 + G_16 + B_16
  color_list.append(color_str)

#描画
ax.scatter(x_hoge, y_hoge, z_hoge, color = color_list, edgecolors="black", s=200 ,alpha=1)


#zx.plot([x_start, x_end], [y_start, y_end], [z_start, z_end])
for i in range(x_hoge.shape[0] - 1):
  ax.plot([x_hoge[i], x_hoge[i + 1]], [y_hoge[i], y_hoge[i]], [z_hoge[i] , z_hoge[i]], c="red")

for i in range(y_hoge.shape[0] - 1):
  ax.plot([x_hoge[i + 1], x_hoge[i + 1]], [y_hoge[i], y_hoge[i + 1]], [z_hoge[i] , z_hoge[i]], c="blue")

for i in range(y_hoge.shape[0] - 1):
  ax.plot([x_hoge[i + 1], x_hoge[i + 1]], [y_hoge[i + 1], y_hoge[i + 1]], [z_hoge[i] , z_hoge[i + 1]], c="green")

plt.show()
### 出力画像