oxyplot関連記事
やりたいこと
前回の記事で、Trackerの中身をカスタムしてみたが、結局見た目はデフォルトのまま(吹き出しみたいな形)だった。
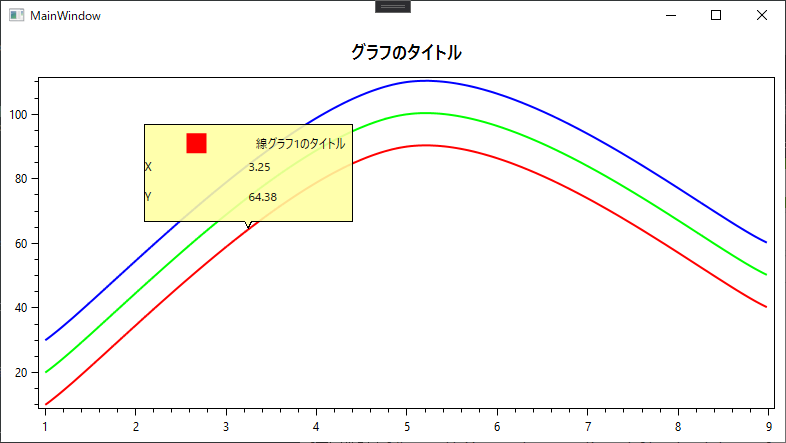
それを、自前で書いた四角の中に囲むとかしたい。
前提
下記を使用。
- .NET Framework 4.7.2
- OxyPlot.Wpf v2.1.0-Preview1(Nuget)
やりかた
<oxy:PlotView.DefaultTrackerTemplate>に設定するTemplateの中身に、
<oxyshared:TrackerControl.Content>を入れて、その中に自前の見た目を入れていたが、
<oxyshared:TrackerControl.Content>を使うのをやめて、自前のCanvasを入れるようにする。
サンプル
画面xaml
コード中にも書いてるが、
DefaultTrackerTemplateの中のデータのSourceは、対応するグラフ(Series)の「TrackerHitResult」なので、そこからいろいろなデータをとれる。
詳細は下記の公式ドキュメントを参照。
※しかし見た目崩れてるし、読んでもよくわからんので、VisualStudio上でTrackerHitResultを選択してF12を押してたどっていった方が、何が取れるかを見やすい。
MainWindow.xaml
<Window x:Class="OxyPlotTest.MainWindow"
        xmlns="http://schemas.microsoft.com/winfx/2006/xaml/presentation"
        xmlns:x="http://schemas.microsoft.com/winfx/2006/xaml"
        xmlns:d="http://schemas.microsoft.com/expression/blend/2008"
        xmlns:mc="http://schemas.openxmlformats.org/markup-compatibility/2006"
        xmlns:local="clr-namespace:OxyPlotTest"
        xmlns:oxy="http://oxyplot.org/wpf"
        xmlns:oxyshared="clr-namespace:OxyPlot.Wpf;assembly=OxyPlot.Wpf.Shared"
        mc:Ignorable="d"
        Title="MainWindow" Height="450" Width="800"
        Name="root">
    <Window.Resources>
        <local:OxyColorToSolidColorBrushConverter x:Key="OxyColorToSolidColorBrushConverter"/>
    </Window.Resources>
    <Grid>
        <!-- グラフ本体 -->
        <oxy:PlotView Model="{Binding Model, ElementName=root}" Controller="{Binding Controller, ElementName=root}" >
            <oxy:PlotView.DefaultTrackerTemplate>
                <!-- DefaultTrackerTemplateの中のデータのSourceは「TrackerHitResult」なので、 -->
                <!-- そこからいろんな情報を取れる -->

                <ControlTemplate>
                    <!-- TrackerControlのContentをセットすると、デフォルトのTrackerの中身をカスタムする形になる。 -->
                    <!-- その場合、Trackerがはみ出さないように位置をええようにやってくれるっぽい -->
                    <!--<Grid>
                        <oxyshared:TrackerControl
                            Position="{Binding Position}"
                            VerticalLineVisibility="Collapsed"
                            HorizontalLineVisibility="Collapsed"
                            LineExtents="{Binding PlotModel.PlotArea}" >

                            <oxyshared:TrackerControl.Content>
                                <UniformGrid Columns="2">
                                    <Rectangle Fill="{Binding Path=.Series, Converter={StaticResource OxyColorToSolidColorBrushConverter}}" Width="20" Height="20" StrokeThickness="3"/>
                                    <TextBlock Text="{Binding Path=.Series.Title}" Margin="7" />
                                    <TextBlock Text="X"/>
                                    <TextBlock Text="{Binding Path=.DataPoint.X, StringFormat={}{0:F2}}"/>
                                    <TextBlock Text="Y"/>
                                    <TextBlock Text="{Binding Path=.DataPoint.Y, StringFormat={}{0:F2}}"/>
                                </UniformGrid>
                            </oxyshared:TrackerControl.Content>
                        </oxyshared:TrackerControl>
                    </Grid>-->

                    <!-- ControlTemplateの直下にCanvasを敷いて位置をPositionにバインドしてやると、 -->
                    <!-- ええかんじの場所にCanvasの中身が出てくれる -->
                    <!-- その場合、位置を自前で調整しないと画面外にはみ出たりする -->
                    <Canvas>
                        <Border CornerRadius="0 6 6 6" BorderBrush="Black" BorderThickness="1" Background="White" Canvas.Left="{Binding Position.X}" Canvas.Top="{Binding Position.Y}" Padding="5" Margin="0">
                            <UniformGrid Columns="2">
                                <Rectangle Fill="{Binding Path=.Series, Converter={StaticResource OxyColorToSolidColorBrushConverter}}" Width="20" Height="20" StrokeThickness="3"/>
                                <TextBlock Text="{Binding Path=.Series.Title}" Margin="7" />
                                <TextBlock Text="X"/>
                                <TextBlock Text="{Binding Path=.DataPoint.X, StringFormat={}{0:F2}}"/>
                                <TextBlock Text="Y"/>
                                <TextBlock Text="{Binding Path=.DataPoint.Y, StringFormat={}{0:F2}}"/>
                            </UniformGrid>
                        </Border>
                    </Canvas>
                </ControlTemplate>
            </oxy:PlotView.DefaultTrackerTemplate>
        </oxy:PlotView>
    </Grid>
</Window>
※コメントアウトしてる部分は、「通常の吹き出し型のTracker」を使ってる部分。
コードビハインド
いろいろ書いてるように見えるが、
赤、緑、青の線グラフを3本適当に引くだけのコード。
Trackerの設定とかはここには出てこない。
MainWindow.xaml.cs
using OxyPlot;
using OxyPlot.Axes;
using OxyPlot.Series;
using System;
using System.Globalization;
using System.Windows;
using System.Windows.Data;
using System.Windows.Media;

namespace OxyPlotTest
{
    public partial class MainWindow : Window
    {
        public MainWindow()
        {
            InitializeComponent();
            Init();
        }
        // OxyPlotのためのモデルとコントローラー
        public PlotModel Model { get; } = new PlotModel();
        public PlotController Controller { get; } = new PlotController();

        // 軸の設定
        public LinearAxis AxisX { get; } = new LinearAxis();
        public LinearAxis AxisY { get; } = new LinearAxis();

        public void Init()
        {
            // X軸の設定
            AxisX.Position = OxyPlot.Axes.AxisPosition.Bottom;    // 軸の位置(topにしたら、目盛りが上にくる)
            // Y軸の設定
            AxisY.Position = OxyPlot.Axes.AxisPosition.Left;      // Y軸の位置(Rightにしたら、目盛りが右にくる)

            // 設定した軸をモデルにセット
            Model.Title = "グラフのタイトル";
            Model.Axes.Add(AxisX);
            Model.Axes.Add(AxisY);

            // 3つ分の線グラフを作成
            for (int i = 0; i < 3; i++)
            {
                // 色
                var r = (byte)(i == 0 ? 0xff : 0);
                var g = (byte)(i == 1 ? 0xff : 0);
                var b = (byte)(i == 2 ? 0xff : 0);

                // 線グラフ
                var LineSeries = new OxyPlot.Series.LineSeries();
                LineSeries.Title = "線グラフ1のタイトル";
                LineSeries.InterpolationAlgorithm = InterpolationAlgorithms.UniformCatmullRomSpline;//グラフの角を丸める
                LineSeries.Color = OxyColor.FromArgb(0xff, r, g, b);        // 上の線の色
                LineSeries.StrokeThickness = 2;                             // 線の太さ
                                                                            // 点を追加
                LineSeries.Points.Add(new DataPoint(1.0, 10.0 + 10.0 * i));
                LineSeries.Points.Add(new DataPoint(5.0, 90.0 + 10.0 * i));
                LineSeries.Points.Add(new DataPoint(9.0, 40.0 + 10.0 * i));
                // 線グラフをモデルに追加
                Model.Series.Add(LineSeries);
            }

            // セットした内容を反映させる
            Model.InvalidatePlot(true);
        }
    }

    // OxyColorから通常のColorのBrushに戻すコンバータ。
    public class OxyColorToSolidColorBrushConverter : IValueConverter
    {
        public object Convert(object value, Type targetType, object parameter, CultureInfo culture)
        {
            if (value is LineSeries ls)
            {
                var oc = ls.Color;
                return new SolidColorBrush(Color.FromArgb(oc.A, oc.R, oc.G, oc.B));
            }
            return null;
        }

        public object ConvertBack(object value, Type targetType, object parameter, CultureInfo culture)
        {
            throw new NotImplementedException();
        }
    }

}
出来上がりの見た目
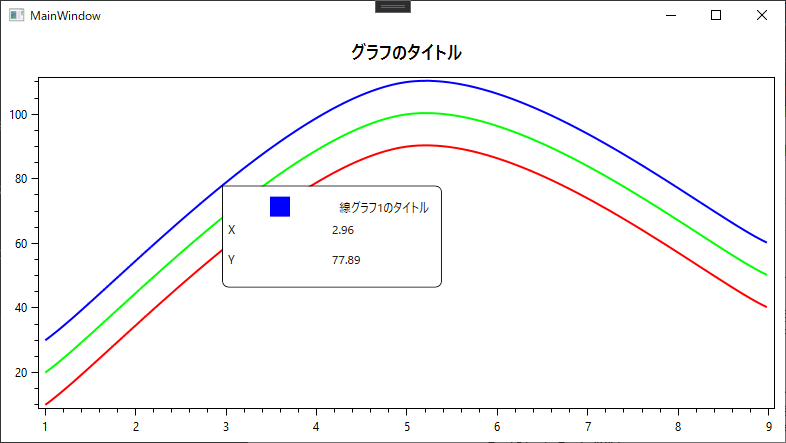
※端までいくとはみ出る
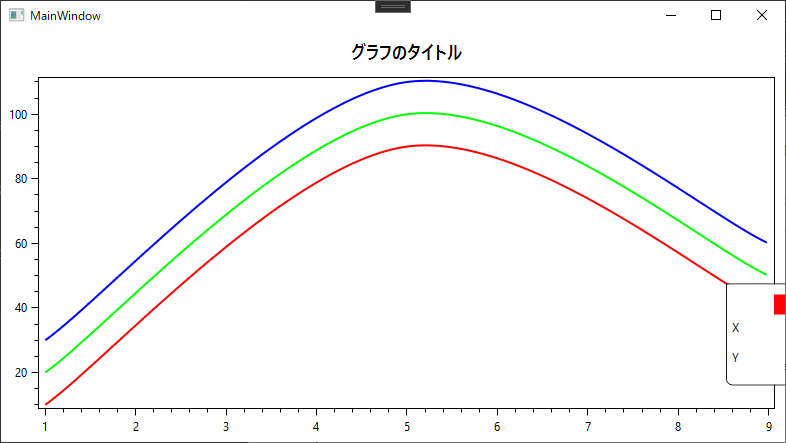
この辺は、PlotAreaの高さと幅を見て、半分よりこっちなら描画位置を変える、的なコンバータを作ってやれば適当にごまかせそう(はみ出るのだけは防げそう)な気がする(試してない)。
参考
公式?のサンプルコード。
ドキュメントをみるよりこれを見た方が、何ができるかはわかりやすい。