oxyplot関連記事
やりたいこと
oxyplotでグラフを出した。
そこに、グラフと軸が交わるところに、そこの値がいくらなのか?を表示してやりたくなった。
その実現のためにいろいろ調べたところ、、注釈表示機能(Annotation)が使えそうな気がする。
Annotationの使い方を練習したい。
やったこと
試した限りでは、上のようなことをするときはRectangleAnnotationで、軸とグラフが交わるところにAnnotationを出して、その中身をその点の値にすればよさそう。
→なのでRectangleAnnotationを使うことになりそうだが、いろんなAnnotationを試してみたのでその時のメモを部品取り用に下記に残す。
部品取りコード
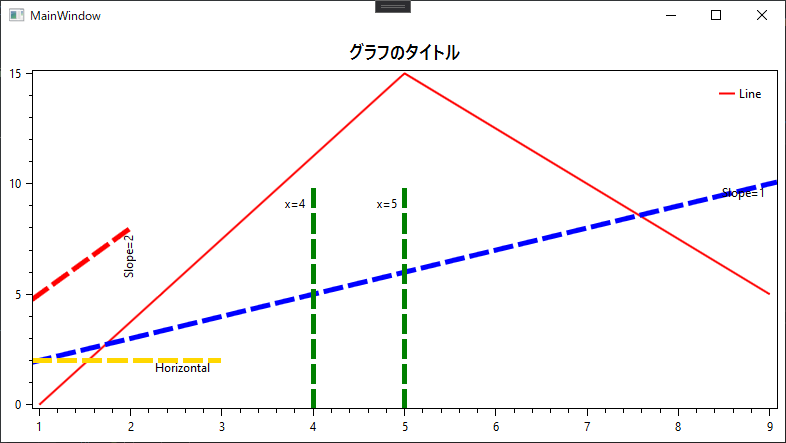
注釈表示(線)
LineAnnotationを使う。
using OxyPlot;
using OxyPlot.Annotations;
using OxyPlot.Axes;
using System.Collections.ObjectModel;
using System.Windows;

namespace WpfApp1
{
    public partial class MainWindow : Window
    {
        // OxyPlotのためのモデルとコントローラー
        public PlotModel Model { get; } = new PlotModel();
        public PlotController Controller { get; } = new PlotController();

        // 軸の設定
        public OxyPlot.Axes.LinearAxis AxisX { get; } = new OxyPlot.Axes.LinearAxis();
        public OxyPlot.Axes.LinearAxis AxisY { get; } = new OxyPlot.Axes.LinearAxis();

        // データを保存するコレクション
        public ObservableCollection<DataPoint> Datas { get; private set; } = new ObservableCollection<DataPoint>();

        public MainWindow()
        {
            InitializeComponent();
            InitGraph();
        }

        // グラフの設定
        public void InitGraph()
        {
            // X軸の設定
            AxisX.Position = OxyPlot.Axes.AxisPosition.Bottom;    // 軸の位置(topにしたら、目盛りが上にくる)
            // Y軸の設定
            AxisY.Position = OxyPlot.Axes.AxisPosition.Left;      // Y軸の位置(Rightにしたら、目盛りが右にくる)

            // 設定した軸をモデルにセット
            Model.Title = "グラフのタイトル";
            Model.Axes.Add(AxisX);
            Model.Axes.Add(AxisY);

            // 線グラフ
            var LineSeries = new OxyPlot.Series.LineSeries();
            LineSeries.Title = "Line";
            LineSeries.Color = OxyColor.FromArgb(0xff, 0xff, 0, 0);     // 上の線の色
            LineSeries.StrokeThickness = 2;                             // 線の太さ
            // データを関連付け加
            LineSeries.ItemsSource = Datas;
            // 点を追加
            Datas.Add(new DataPoint(1.0, 0.0));
            Datas.Add(new DataPoint(5.0, 15.0));
            Datas.Add(new DataPoint(9.0, 5.0));
            // グラフをモデルに追加
            Model.Series.Add(LineSeries);

            // Annotationを追加
            Model.Annotations.Add(new LineAnnotation { StrokeThickness = 5, Slope = 1, Intercept = 1, Text = "Slope=1", TextOrientation = AnnotationTextOrientation.Horizontal });
            Model.Annotations.Add(new LineAnnotation { StrokeThickness = 5, Slope = 3, Intercept = 2, MaximumX = 2, Color = OxyColors.Red, Text = "Slope=2", TextOrientation = AnnotationTextOrientation.Vertical });
            Model.Annotations.Add(new LineAnnotation { StrokeThickness = 5, Type = LineAnnotationType.Vertical, X = 4, MaximumY = 10, Color = OxyColors.Green, Text = "x=4", TextPadding = 8, TextOrientation = AnnotationTextOrientation.Horizontal });
            Model.Annotations.Add(new LineAnnotation { StrokeThickness = 5, Type = LineAnnotationType.Vertical, X = 5, MaximumY = 10, Color = OxyColors.Green, Text = "x=5", TextPadding = 8, TextOrientation = AnnotationTextOrientation.Horizontal });
            Model.Annotations.Add(new LineAnnotation { StrokeThickness = 5, Type = LineAnnotationType.Horizontal, Y = 2, MaximumX = 3, Color = OxyColors.Gold, Text = "Horizontal", TextOrientation = AnnotationTextOrientation.Horizontal });

            // セットした内容を反映させる
            Model.InvalidatePlot(true);
        }
    }
}
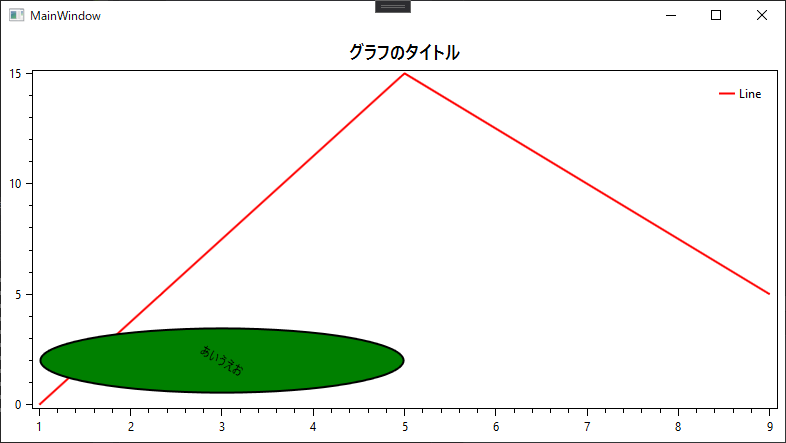
注釈(楕円)
EllipseAnnotationを使う。
using OxyPlot;
using OxyPlot.Annotations;
using OxyPlot.Axes;
using System.Collections.ObjectModel;
using System.Windows;

namespace WpfApp1
{
    public partial class MainWindow : Window
    {
        // OxyPlotのためのモデルとコントローラー
        public PlotModel Model { get; } = new PlotModel();
        public PlotController Controller { get; } = new PlotController();

        // 軸の設定
        public OxyPlot.Axes.LinearAxis AxisX { get; } = new OxyPlot.Axes.LinearAxis();
        public OxyPlot.Axes.LinearAxis AxisY { get; } = new OxyPlot.Axes.LinearAxis();

        // データを保存するコレクション
        public ObservableCollection<DataPoint> Datas { get; private set; } = new ObservableCollection<DataPoint>();

        public MainWindow()
        {
            InitializeComponent();
            InitGraph();
        }

        // グラフの設定
        public void InitGraph()
        {
            // X軸の設定
            AxisX.Position = OxyPlot.Axes.AxisPosition.Bottom;    // 軸の位置(topにしたら、目盛りが上にくる)
            // Y軸の設定
            AxisY.Position = OxyPlot.Axes.AxisPosition.Left;      // Y軸の位置(Rightにしたら、目盛りが右にくる)

            // 設定した軸をモデルにセット
            Model.Title = "グラフのタイトル";
            Model.Axes.Add(AxisX);
            Model.Axes.Add(AxisY);

            // 線グラフ
            var LineSeries = new OxyPlot.Series.LineSeries();
            LineSeries.Title = "Line";
            LineSeries.Color = OxyColor.FromArgb(0xff, 0xff, 0, 0);     // 上の線の色
            LineSeries.StrokeThickness = 2;                             // 線の太さ
            // データを関連付け加
            LineSeries.ItemsSource = Datas;
            // 点を追加
            Datas.Add(new DataPoint(1.0, 0.0));
            Datas.Add(new DataPoint(5.0, 15.0));
            Datas.Add(new DataPoint(9.0, 5.0));
            // グラフをモデルに追加
            Model.Series.Add(LineSeries);

            // EllipseAnnotation
            Model.Annotations.Add(new EllipseAnnotation
            {
                X = 3,                      // 中心点X
                Y = 2,                      // 中心点Y
                Text = "あいうえお",
                TextRotation = 30,          // 文字の傾き
                Width = 4,                  // 横幅
                Height = 3,                 // 縦幅
                Fill = OxyColors.Green,
                Stroke = OxyColors.Black,
                StrokeThickness = 2
            });

            // セットした内容を反映させる
            Model.InvalidatePlot(true);
        }
    }
}
注釈(四角)
RectangleAnnotationを使う。
using OxyPlot;
using OxyPlot.Annotations;
using OxyPlot.Axes;
using System.Collections.ObjectModel;
using System.Windows;

namespace WpfApp1
{
    public partial class MainWindow : Window
    {
        // OxyPlotのためのモデルとコントローラー
        public PlotModel Model { get; } = new PlotModel();
        public PlotController Controller { get; } = new PlotController();

        // 軸の設定
        public OxyPlot.Axes.LinearAxis AxisX { get; } = new OxyPlot.Axes.LinearAxis();
        public OxyPlot.Axes.LinearAxis AxisY { get; } = new OxyPlot.Axes.LinearAxis();

        // データを保存するコレクション
        public ObservableCollection<DataPoint> Datas { get; private set; } = new ObservableCollection<DataPoint>();

        public MainWindow()
        {
            InitializeComponent();
            InitGraph();
        }

        // グラフの設定
        public void InitGraph()
        {
            // X軸の設定
            AxisX.Position = OxyPlot.Axes.AxisPosition.Bottom;    // 軸の位置(topにしたら、目盛りが上にくる)
            // Y軸の設定
            AxisY.Position = OxyPlot.Axes.AxisPosition.Left;      // Y軸の位置(Rightにしたら、目盛りが右にくる)

            // 設定した軸をモデルにセット
            Model.Title = "グラフのタイトル";
            Model.Axes.Add(AxisX);
            Model.Axes.Add(AxisY);

            // 線グラフ
            var LineSeries = new OxyPlot.Series.LineSeries();
            LineSeries.Title = "Line";
            LineSeries.Color = OxyColor.FromArgb(0xff, 0xff, 0, 0);     // 上の線の色
            LineSeries.StrokeThickness = 2;                             // 線の太さ
            // データを関連付け加
            LineSeries.ItemsSource = Datas;
            // 点を追加
            Datas.Add(new DataPoint(1.0, 0.0));
            Datas.Add(new DataPoint(5.0, 15.0));
            Datas.Add(new DataPoint(9.0, 5.0));
            // グラフをモデルに追加
            Model.Series.Add(LineSeries);

            // RectangleAnnotation
            Model.Annotations.Add(new RectangleAnnotation
            {
                MinimumX = 3,
                MaximumX = 6,
                MinimumY = 2,
                MaximumY = 5,
                TextRotation = 10,
                Text = "あいうえお",
                Fill = OxyColors.Blue,
                Stroke = OxyColors.Black,
                StrokeThickness = 2
            });

            // セットした内容を反映させる
            Model.InvalidatePlot(true);
        }
    }
}
注釈(ポリゴン)
PolygonAnnotationを使う。
using OxyPlot;
using OxyPlot.Annotations;
using OxyPlot.Axes;
using System.Collections.ObjectModel;
using System.Windows;

namespace WpfApp1
{
    public partial class MainWindow : Window
    {
        // OxyPlotのためのモデルとコントローラー
        public PlotModel Model { get; } = new PlotModel();
        public PlotController Controller { get; } = new PlotController();

        // 軸の設定
        public OxyPlot.Axes.LinearAxis AxisX { get; } = new OxyPlot.Axes.LinearAxis();
        public OxyPlot.Axes.LinearAxis AxisY { get; } = new OxyPlot.Axes.LinearAxis();

        // データを保存するコレクション
        public ObservableCollection<DataPoint> Datas { get; private set; } = new ObservableCollection<DataPoint>();

        public MainWindow()
        {
            InitializeComponent();
            InitGraph();
        }

        // グラフの設定
        public void InitGraph()
        {
            // X軸の設定
            AxisX.Position = OxyPlot.Axes.AxisPosition.Bottom;    // 軸の位置(topにしたら、目盛りが上にくる)
            // Y軸の設定
            AxisY.Position = OxyPlot.Axes.AxisPosition.Left;      // Y軸の位置(Rightにしたら、目盛りが右にくる)

            // 設定した軸をモデルにセット
            Model.Title = "グラフのタイトル";
            Model.Axes.Add(AxisX);
            Model.Axes.Add(AxisY);

            // 線グラフ
            var LineSeries = new OxyPlot.Series.LineSeries();
            LineSeries.Title = "Line";
            LineSeries.Color = OxyColor.FromArgb(0xff, 0xff, 0, 0);     // 上の線の色
            LineSeries.StrokeThickness = 2;                             // 線の太さ
            // データを関連付け加
            LineSeries.ItemsSource = Datas;
            // 点を追加
            Datas.Add(new DataPoint(1.0, 0.0));
            Datas.Add(new DataPoint(5.0, 15.0));
            Datas.Add(new DataPoint(9.0, 5.0));
            // グラフをモデルに追加
            Model.Series.Add(LineSeries);

            // PolygonAnnotation
            var aaa = new PolygonAnnotation();
            aaa.Points.Add(new DataPoint(1, 1));
            aaa.Points.Add(new DataPoint(1, 5));
            aaa.Points.Add(new DataPoint(5, 5));
            aaa.Points.Add(new DataPoint(5, 1));
            aaa.Points.Add(new DataPoint(3, 3));
            aaa.Text = "polygon";
            Model.Annotations.Add(aaa);

            // セットした内容を反映させる
            Model.InvalidatePlot(true);
        }
    }
}


