oxyplot関連記事
やりたいこと
WPFで、グラフを表示するアプリをやることになり「oxyplot」というライブラリを使うこととなった。
使い方を練習したい。
※横軸を時間、縦軸に数値、のようなグラフを扱ったので、そういうグラフのみまずは挙げておく。
(円グラフとかは今回やってないので一旦対象外。)
今回の前提
下記を使用する。
部品取りコード
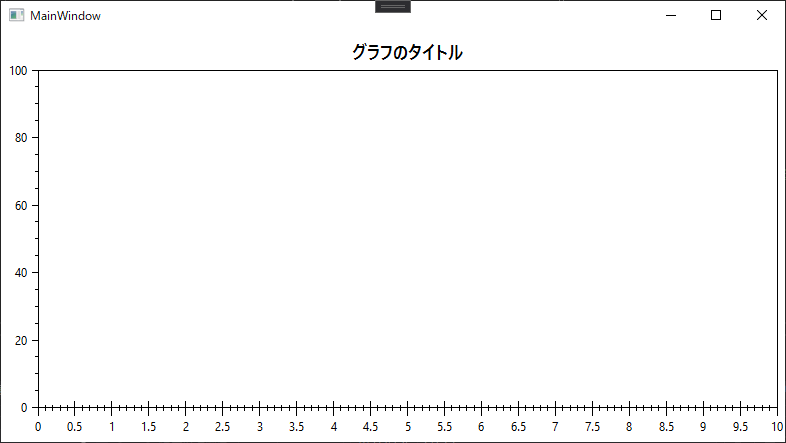
横軸、縦軸の設定
基本の軸の設定。
<Window x:Class="WpfApp1.MainWindow"
        xmlns="http://schemas.microsoft.com/winfx/2006/xaml/presentation"
        xmlns:x="http://schemas.microsoft.com/winfx/2006/xaml"
        xmlns:d="http://schemas.microsoft.com/expression/blend/2008"
        xmlns:mc="http://schemas.openxmlformats.org/markup-compatibility/2006"
        xmlns:local="clr-namespace:WpfApp1"
        xmlns:oxy="http://oxyplot.org/wpf"
        mc:Ignorable="d"
        Title="MainWindow" Height="450" Width="800"
        Name="root">
    <Grid>
        <oxy:PlotView Model="{Binding Model, ElementName=root}" Controller="{Binding Controller, ElementName=root}" />
    </Grid>
</Window>
using OxyPlot;
using OxyPlot.Axes;
using System.Windows;

namespace WpfApp1
{
    public partial class MainWindow : Window
    {
        // OxyPlotのためのモデルとコントローラー
        public PlotModel Model { get; } = new PlotModel();
        public PlotController Controller { get; } = new PlotController();

        // 軸の設定
        public OxyPlot.Axes.LinearAxis AxisX { get; } = new OxyPlot.Axes.LinearAxis();
        public OxyPlot.Axes.LinearAxis AxisY { get; } = new OxyPlot.Axes.LinearAxis();

        public MainWindow()
        {
            InitializeComponent();
            InitGraph();
        }

        // グラフの設定
        public void InitGraph()
        {
            // X軸の設定
            AxisX.Position = OxyPlot.Axes.AxisPosition.Bottom;    // 軸の位置(topにしたら、目盛りが上にくる)
            AxisX.MajorStep = 0.5;                                // 大きなTickの間隔
            AxisX.MajorTickSize = 10;                             // 大きなTickの長さ
            AxisX.TickStyle = TickStyle.Crossing;                 // Tickのスタイル(ナシにもできる)
            AxisX.MinorStep = 0.1;                                // 小さなTickの間隔
            AxisX.Maximum = 10.0;                                 // 右端のX軸の値
            // Y軸の設定
            AxisY.Position = OxyPlot.Axes.AxisPosition.Left;      // Y軸の位置(Rightにしたら、目盛りが右にくる)
            AxisY.Minimum = 0.0;                                  // 左端のX軸の値

            // 設定した軸をモデルにセット
            Model.Title = "グラフのタイトル";
            Model.Axes.Add(AxisX);
            Model.Axes.Add(AxisY);

            // セットした内容を反映させる
            Model.InvalidatePlot(true);
        }
    }
}
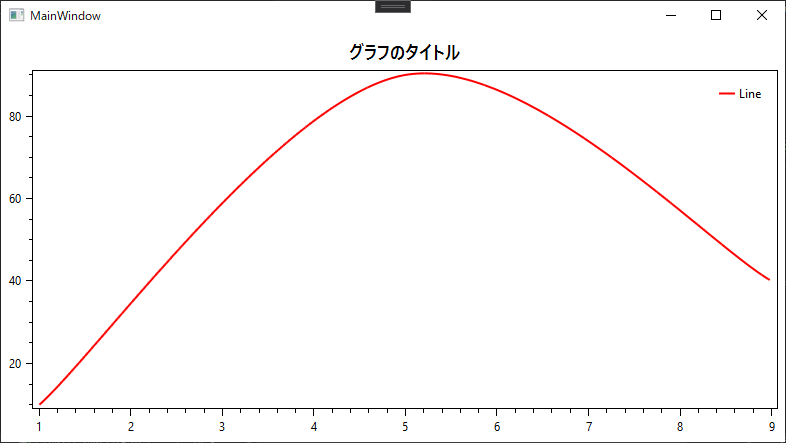
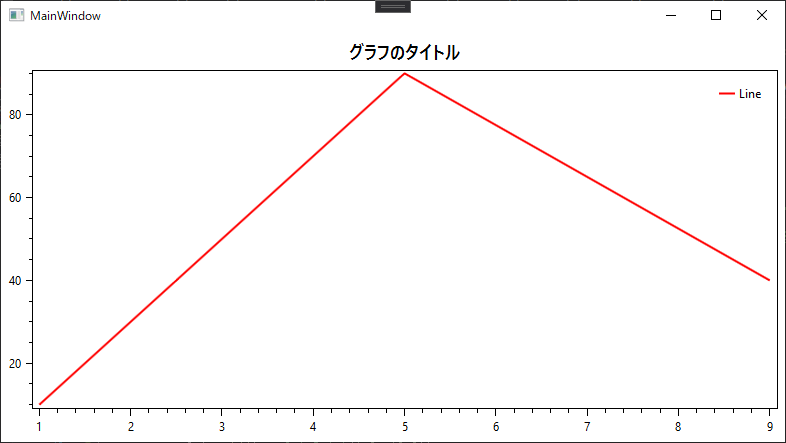
線グラフ
LineSeriesを使う。
using OxyPlot;
using OxyPlot.Axes;
using System.Windows;

namespace WpfApp1
{
    public partial class MainWindow : Window
    {
        // OxyPlotのためのモデルとコントローラー
        public PlotModel Model { get; } = new PlotModel();
        public PlotController Controller { get; } = new PlotController();

        // 軸の設定
        public OxyPlot.Axes.LinearAxis AxisX { get; } = new OxyPlot.Axes.LinearAxis();
        public OxyPlot.Axes.LinearAxis AxisY { get; } = new OxyPlot.Axes.LinearAxis();

        public MainWindow()
        {
            InitializeComponent();
            InitGraph();
        }

        // グラフの設定
        public void InitGraph()
        {
            // X軸の設定
            AxisX.Position = OxyPlot.Axes.AxisPosition.Bottom;    // 軸の位置(topにしたら、目盛りが上にくる)
            // Y軸の設定
            AxisY.Position = OxyPlot.Axes.AxisPosition.Left;      // Y軸の位置(Rightにしたら、目盛りが右にくる)

            // 設定した軸をモデルにセット
            Model.Title = "グラフのタイトル";
            Model.Axes.Add(AxisX);
            Model.Axes.Add(AxisY);

            // 線グラフ
            var LineSeries = new OxyPlot.Series.LineSeries();
            LineSeries.Title = "Line";
            LineSeries.InterpolationAlgorithm = InterpolationAlgorithms.UniformCatmullRomSpline;//グラフの角を丸める
            LineSeries.Color = OxyColor.FromArgb(0xff, 0xff, 0, 0);     // 上の線の色
            LineSeries.StrokeThickness = 2;                             // 線の太さ
            // 点を追加
            LineSeries.Points.Add(new DataPoint(1.0, 10.0));
            LineSeries.Points.Add(new DataPoint(5.0, 90.0));
            LineSeries.Points.Add(new DataPoint(9.0, 40.0));
            // 線グラフをモデルに追加
            Model.Series.Add(LineSeries);

            // セットした内容を反映させる
            Model.InvalidatePlot(true);
        }
    }
}
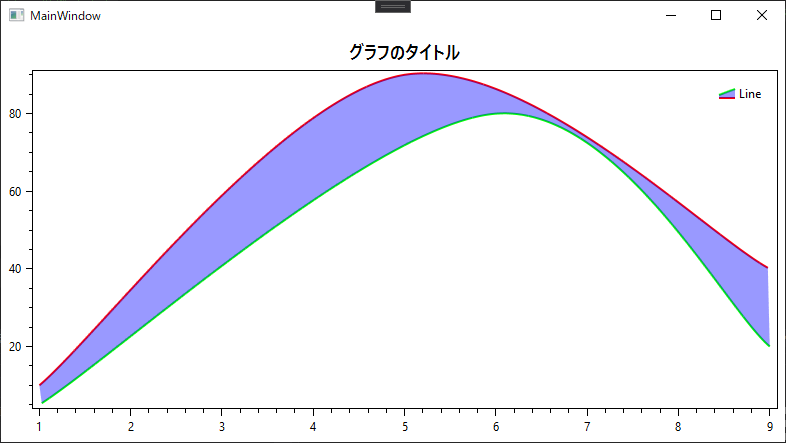
二本線グラフ
AreaSeriesを使う。
上の線と下の線の間に色を付けたりできる。
using OxyPlot;
using OxyPlot.Axes;
using System.Windows;

namespace WpfApp1
{
    public partial class MainWindow : Window
    {
        // OxyPlotのためのモデルとコントローラー
        public PlotModel Model { get; } = new PlotModel();
        public PlotController Controller { get; } = new PlotController();

        // 軸の設定
        public OxyPlot.Axes.LinearAxis AxisX { get; } = new OxyPlot.Axes.LinearAxis();
        public OxyPlot.Axes.LinearAxis AxisY { get; } = new OxyPlot.Axes.LinearAxis();

        public MainWindow()
        {
            InitializeComponent();
            InitGraph();
        }

        // グラフの設定
        public void InitGraph()
        {
            // X軸の設定
            AxisX.Position = OxyPlot.Axes.AxisPosition.Bottom;    // 軸の位置(topにしたら、目盛りが上にくる)
            // Y軸の設定
            AxisY.Position = OxyPlot.Axes.AxisPosition.Left;      // Y軸の位置(Rightにしたら、目盛りが右にくる)

            // 設定した軸をモデルにセット
            Model.Title = "グラフのタイトル";
            Model.Axes.Add(AxisX);
            Model.Axes.Add(AxisY);

            // 二本線グラフ
            var LineSeries = new OxyPlot.Series.AreaSeries();// Point(上)とPoint2(下)の2つの値をsetしたら、その間に色をつけれる
            LineSeries.Title = "Line";
            LineSeries.InterpolationAlgorithm = InterpolationAlgorithms.UniformCatmullRomSpline;//グラフの角を丸める
            LineSeries.Color = OxyColor.FromArgb(0xff, 0xff, 0, 0);     // 上の線の色
            LineSeries.Color2 = OxyColor.FromArgb(0xff, 0x0, 0xff, 0);  // 下の線の色
            LineSeries.Fill = OxyColor.FromArgb(0x66, 0x0, 0, 0xff);    // 塗る色
            LineSeries.StrokeThickness = 2;                             // 線の太さ
            // 点(上の線)を追加
            LineSeries.Points.Add(new DataPoint(1.0, 10.0));
            LineSeries.Points.Add(new DataPoint(5.0, 90.0));
            LineSeries.Points.Add(new DataPoint(9.0, 40.0));
            // 点(下の線)を追加
            LineSeries.Points2.Add(new DataPoint(1.0, 5.0));
            LineSeries.Points2.Add(new DataPoint(6.0, 80.0));
            LineSeries.Points2.Add(new DataPoint(9.0, 20.0));
            // 線グラフをモデルに追加
            Model.Series.Add(LineSeries);

            // セットした内容を反映させる
            Model.InvalidatePlot(true);
        }
    }
}
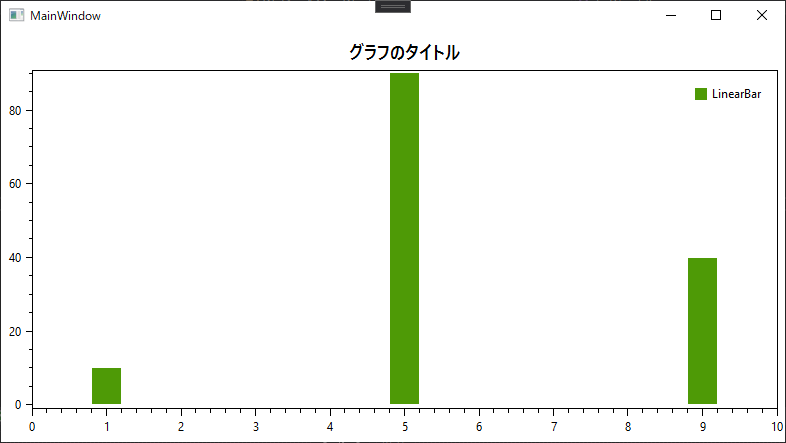
棒グラフ
LinearBarSeriesを使う。
棒の太さはコードから調整できる。
using OxyPlot;
using OxyPlot.Axes;
using System.Windows;

namespace WpfApp1
{
    public partial class MainWindow : Window
    {
        // OxyPlotのためのモデルとコントローラー
        public PlotModel Model { get; } = new PlotModel();
        public PlotController Controller { get; } = new PlotController();

        // 軸の設定
        public OxyPlot.Axes.LinearAxis AxisX { get; } = new OxyPlot.Axes.LinearAxis();
        public OxyPlot.Axes.LinearAxis AxisY { get; } = new OxyPlot.Axes.LinearAxis();

        public MainWindow()
        {
            InitializeComponent();
            InitGraph();
        }

        // グラフの設定
        public void InitGraph()
        {
            // X軸の設定
            AxisX.Position = OxyPlot.Axes.AxisPosition.Bottom;    // 軸の位置(topにしたら、目盛りが上にくる)
            AxisX.Maximum = 10.0;
            AxisX.Minimum = 0.0;
            // Y軸の設定
            AxisY.Position = OxyPlot.Axes.AxisPosition.Left;      // Y軸の位置(Rightにしたら、目盛りが右にくる)

            // 設定した軸をモデルにセット
            Model.Title = "グラフのタイトル";
            Model.Axes.Add(AxisX);
            Model.Axes.Add(AxisY);

            // 棒グラフ
            var BarSeries = new OxyPlot.Series.LinearBarSeries();
            BarSeries.Title = "LinearBar";
            BarSeries.BarWidth = 30;
            // 点を追加
            BarSeries.Points.Add(new DataPoint(1.0, 10.0));
            BarSeries.Points.Add(new DataPoint(5.0, 90.0));
            BarSeries.Points.Add(new DataPoint(9.0, 40.0));
            // グラフをモデルに追加
            Model.Series.Add(BarSeries);

            // セットした内容を反映させる
            Model.InvalidatePlot(true);
        }
    }
}
棒グラフの太さメモ
グラフを表示している領域の幅はModel.PlotArea.Widthでとることができる。
(上の図だと、X軸の0と表示されているところ~10と表示されているところ、までの長さ)
等間隔に棒グラフを表示させるような場合は、そのWidthと棒の本数で、太さ(barSeries.BarWidth)の値を計算できるかもしれない。
データをObservableCollectionで管理する
ObservableCollectionを作って、それをSeriesのItemsSourceに指定する。
using OxyPlot;
using OxyPlot.Axes;
using System.Collections.ObjectModel;
using System.Windows;

namespace WpfApp1
{
    public partial class MainWindow : Window
    {
        // OxyPlotのためのモデルとコントローラー
        public PlotModel Model { get; } = new PlotModel();
        public PlotController Controller { get; } = new PlotController();

        // 軸の設定
        public OxyPlot.Axes.LinearAxis AxisX { get; } = new OxyPlot.Axes.LinearAxis();
        public OxyPlot.Axes.LinearAxis AxisY { get; } = new OxyPlot.Axes.LinearAxis();

        // データを保存するコレクション
        public ObservableCollection<DataPoint> Datas { get; private set; } = new ObservableCollection<DataPoint>();

        public MainWindow()
        {
            InitializeComponent();
            InitGraph();
        }

        // グラフの設定
        public void InitGraph()
        {
            // X軸の設定
            AxisX.Position = OxyPlot.Axes.AxisPosition.Bottom;    // 軸の位置(topにしたら、目盛りが上にくる)
            // Y軸の設定
            AxisY.Position = OxyPlot.Axes.AxisPosition.Left;      // Y軸の位置(Rightにしたら、目盛りが右にくる)

            // 設定した軸をモデルにセット
            Model.Title = "グラフのタイトル";
            Model.Axes.Add(AxisX);
            Model.Axes.Add(AxisY);

            // 線グラフ
            var LineSeries = new OxyPlot.Series.LineSeries();
            LineSeries.Title = "Line";
            LineSeries.Color = OxyColor.FromArgb(0xff, 0xff, 0, 0);     // 上の線の色
            LineSeries.StrokeThickness = 2;                             // 線の太さ
            // データを関連付け加
            LineSeries.ItemsSource = Datas;
            // 点を追加
            Datas.Add(new DataPoint(1.0, 10.0));
            Datas.Add(new DataPoint(5.0, 90.0));
            Datas.Add(new DataPoint(9.0, 40.0));
            // グラフをモデルに追加
            Model.Series.Add(LineSeries);

            // セットした内容を反映させる
            Model.InvalidatePlot(true);
        }
    }
}
参考


