はじめに
前回、OpenCVを利用して車載カメラ画像から白線を検出しました。
白線だけでなく、白線以外の直線も多く検出する結果となりました。
道路の白線のみを検出するために、道路とそれ以外の領域を分割する必要がありそうです。
まずは、道路とそれ以外の部分のテクスチャの違いに着目して、分割することを目指してみます。
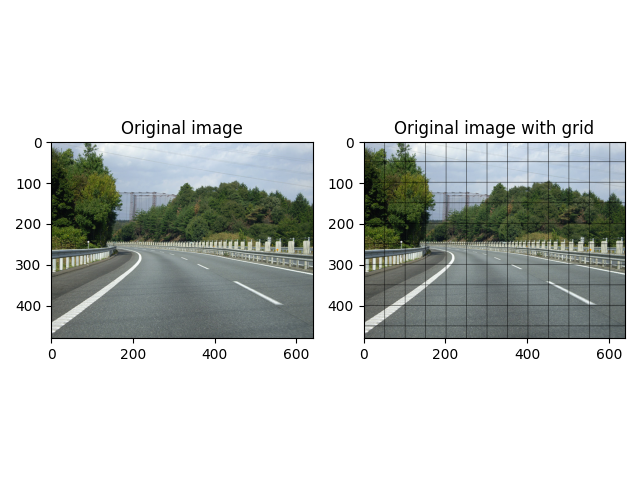
今回のゴールは下図です。


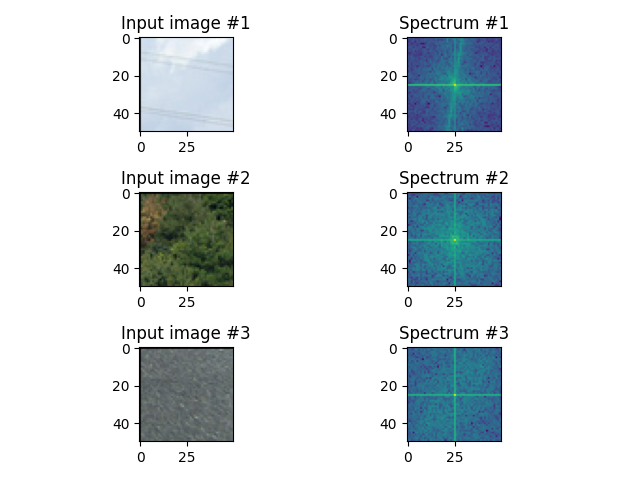
「空の領域」、「木々の領域」、「道路の領域」の画像を切り出し、各画像にフーリエ変換を適用します。各画像の周波数領域の違いを確認することを目指します。
- 入力画像から各領域を切り出す
- 切り出した画像にフーリエ変換を適用する
コードを書いていく
Step0. 準備
Python 3.10.8、opencv 4.7.0を利用します。いつも通りimportする。
import cv2
import numpy as np
from matplotlib import pyplot as plt
Step1. 入力画像にグリッド線を描画する
切り出したい各領域を目視で確認しやすくするために、グリッド線を入力画像に描画してみます。
# 画像の入力
input_img = cv2.imread('michi.jpg')
original = input_img.copy() #原画像も一応コピーして残す

# グリッド線を描画する準備(何Pixel毎に格子を描画するか)
xd_grid = 50
yd_grid = 50
img_y, img_x = input_img.shape[:2]# 画像の縦横の大きさ取得

# 任意のpixel数の格子を黒接で描画する
input_img[yd_grid : img_y : yd_grid, :, :] = 0
input_img[:, xd_grid : img_x : xd_grid, :] = 0
cv2.imwrite('with_grid.png', input_img)
Step2. 任意の領域を切り抜く
# 切り抜き #1 空
# 画像特有の座標系(j, i)に注意する
cut_img1 = input_img[0 : 50, 350: 400]# [y軸(縦)方向, x軸(横)方向]
# 切り抜き #2 木々
cut_img2 = input_img[150 : 200, 350: 400]
# 切り抜き #3 道路
cut_img3 = input_img[400 : 450, 350: 400]
Step3. 切り出し画像にフーリエ変換を適用する
# 切り抜き画像をグレースケールに変換
gray_img1 = cv2.cvtColor(cut_img1, cv2.COLOR_BGR2GRAY)
gray_img2 = cv2.cvtColor(cut_img2, cv2.COLOR_BGR2GRAY)
gray_img3 = cv2.cvtColor(cut_img3, cv2.COLOR_BGR2GRAY)

# 切り抜き画像に対して、それぞれフーリエ変換
f_1 = np.fft.fft2(gray_img1)
fshift_1 = np.fft.fftshift(f_1)

f_2 = np.fft.fft2(gray_img2)
fshift_2 = np.fft.fftshift(f_2)

f_3 = np.fft.fft2(gray_img3)
fshift_3 = np.fft.fftshift(f_3)

# Spectrum画像の作成
spe_1 = 20*np.log(np.abs(fshift_1))
spe_2 = 20*np.log(np.abs(fshift_2))
spe_3 = 20*np.log(np.abs(fshift_3))
Step4. 処理結果を描画する
plt.subplot(321)
plt.imshow(cv2.cvtColor(cut_img1, cv2.COLOR_BGR2RGB))
plt.title('Input image #1')
plt.subplot(322)
plt.imshow(spe_1)
plt.title('Spectrum #1')

plt.subplot(323)
plt.imshow(cv2.cvtColor(cut_img2, cv2.COLOR_BGR2RGB))
plt.title('Input image #2')
plt.subplot(324)
plt.imshow(spe_2)
plt.title('Spectrum #2')

plt.subplot(325)
plt.imshow(cv2.cvtColor(cut_img3, cv2.COLOR_BGR2RGB))
plt.title('Input image #3')
plt.subplot(326)
plt.imshow(spe_3)
plt.title('Spectrum #3')

plt.tight_layout()# 図を重ねない。
plt.savefig("output.png")# 結果を画像で保存する
plt.show()
おわりに
原画像から任意の領域を複数切り抜いて、フーリエ変換を適用してみました。
フーリエ変換により画像が周波数領域に変換されましたが、目視では各画像の違いが分かりづらかったです。
あくまで目視での比較なので、今度はデジタルに比較してみたいと思います。
(参考)入力画像は、写真素材ルーム様の素材を利用いたしました。