万年初心者の備忘録です。
今回は、三次元のグラフをGoogleColaboratoryで出力する方法について。
この記事は初心者が書いたものです。
間違っていたり、冗長だったり、煩雑だったりするかもしれません。
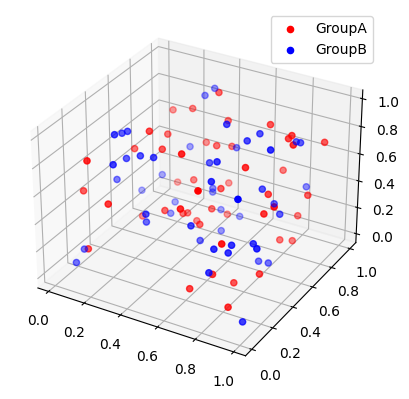
matplotlibを使う方法
グラフをマウスでぐりぐり動かすことはできません。
動かしたいときはplotlyを使いましょう。
コード
import matplotlib.pyplot as plt
import numpy as np
from mpl_toolkits.mplot3d import Axes3D

# ラベル
l1,l2 = "GroupA","GroupB"

# プロットする座標の設定
x1 = np.random.rand(50)
y1 = np.random.rand(50)
z1 = np.random.rand(50)
x2 = np.random.rand(50)
y2 = np.random.rand(50)
z2 = np.random.rand(50)

#グラフの作成
fig = plt.figure() # キャンバスを作る
ax = fig.add_subplot(projection='3d') # 座標系を作る

ax.scatter(x1, y1, z1, color='red', label=l1) # GroupAについての散布図
ax.scatter(x2, y2, z2, color='blue', label=l2) # GroupBについての散布図

ax.set_title("Comparison of GroupA and GroupB") #グラフタイトル
ax.legend(loc=0)    # 凡例

plt.show()
補足…figとかaxって何?
fig
figは、グラフ全体の「キャンバス」に相当するオブジェクト。
- 複数のグラフをまとめて描画する
- グラフのサイズなどを管理する
上記コードでは、fig = plt.figure()によって新しいキャンバス(グラフ全体)を作成しています。
ax
axは、グラフ上の個々の領域を担当するオブジェクト。
-
figで作成したキャンバスに散布図や棒グラフなどを追加 - 軸ラベルや範囲を指定
- 凡例を設定
上記コードでは、ax=fig.add_subplot(projection='3d')によって3Dプロット用の座標系をキャンバス上に追加しています。
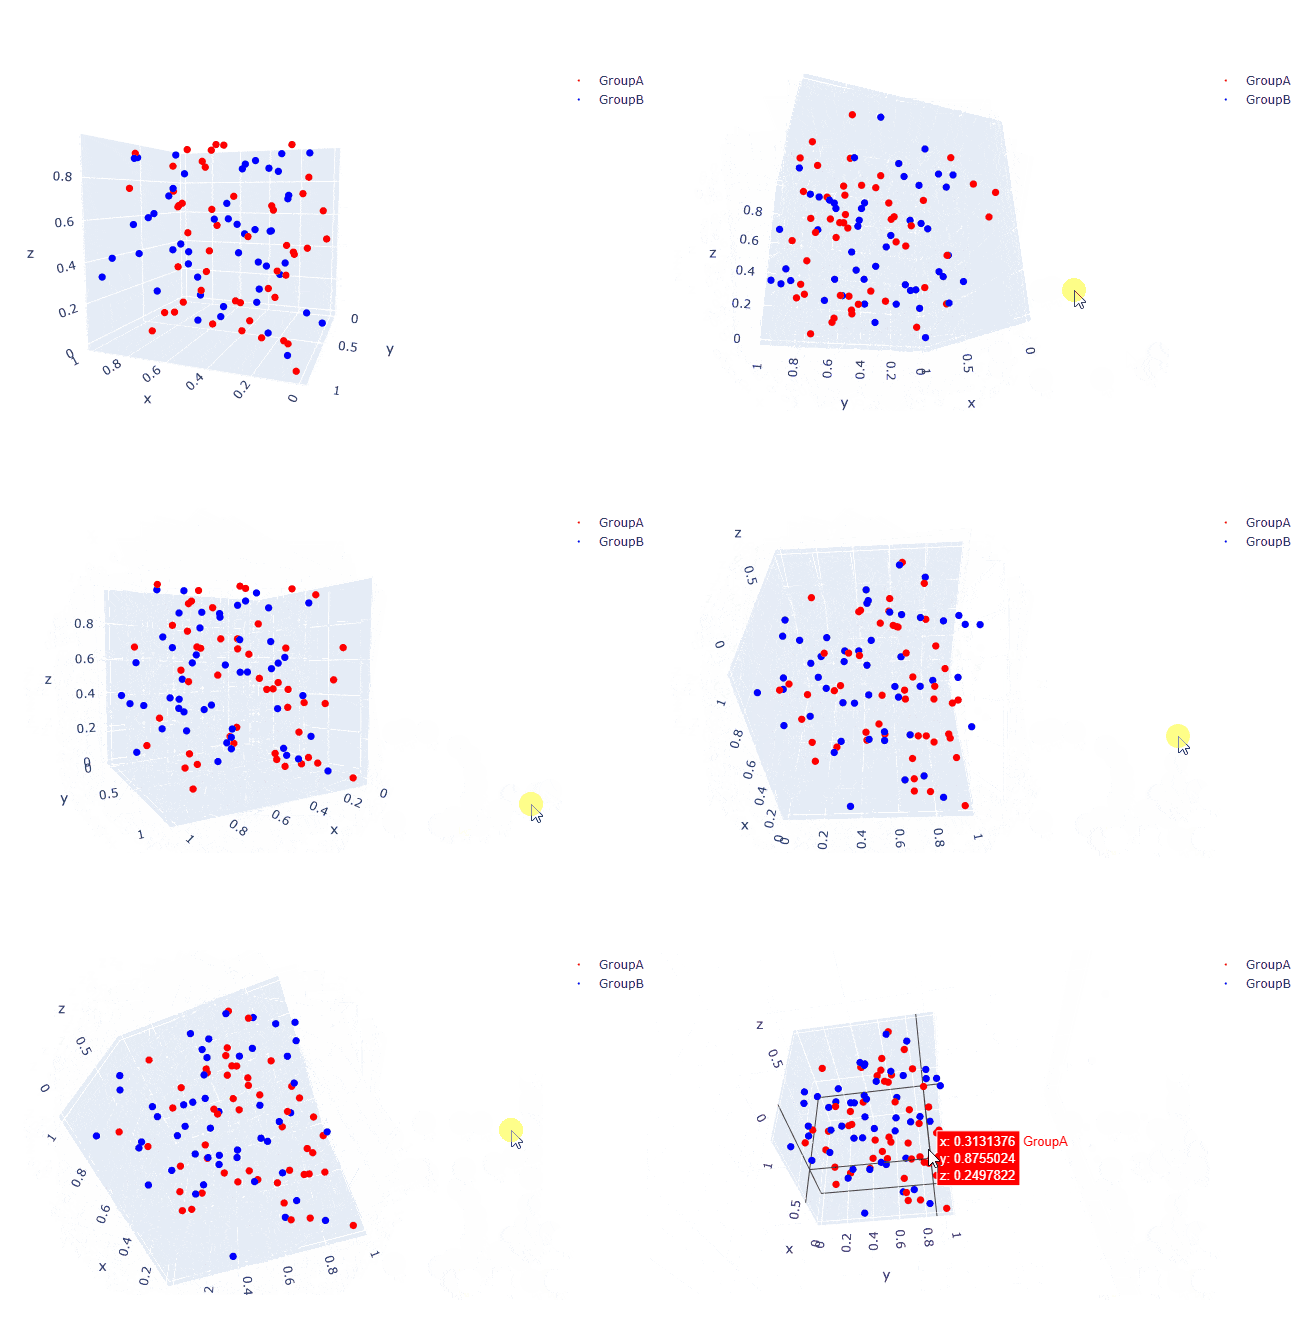
plotlyを使う方法
こんな感じにマウスで動かしたり、拡大縮小したりできます。
マウスで動かしたいときはこの方法を使います。好きな角度・縮尺でpng画像として保存することも可能です。
コード
import plotly.graph_objects as go
import numpy as np

fig = go.Figure() # グラフの作成

# ラベル
l1,l2 = "GroupA","GroupB"

# 座標の設定
x1 = np.random.rand(50)
y1 = np.random.rand(50)
z1 = np.random.rand(50)
x2 = np.random.rand(50)
y2 = np.random.rand(50)
z2 = np.random.rand(50)

# GroupAについての散布図
fig.add_trace(go.Scatter3d(x=x1, y=y1, z=z1,
                           mode='markers',
                           name=l1,
                           marker=dict(color='red', size=2, symbol='circle'),))

# GroupBについての散布図
fig.add_trace(go.Scatter3d(x=x2, y=y2, z=z2,
                           mode='markers',
                           name=l2,
                           marker=dict(color='blue', size=2, symbol='circle'),))
# 表示
fig.show()
補足…散布図の設定について
-
fig.add_trace()部分でグラフを追加することを示しています -
go.Scatter3d()部分で3Dの散布図を表しています
go.Scatter3d()の引数
-
mode:"markers"(点のみ)、"lines"(線のみ)、"lines+markers"(点と線)などが指定可能 -
name: 凡例ラベル -
marker: マーカーのスタイルを設定(辞書型の引数) -
line: 線のスタイルを設定(辞書型の引数)
go.Scatter3d()の引数marker、lineは、modeの引数によっては利用できません。
mode="markers"とすれば引数marker、
mode="lines"とすれば引数lineが使えます。
さらに:markerの引数
辞書型dict()の中に以下のようなスタイルを設定できます。
-
size: マーカーのサイズ -
color: マーカーの色 (リストを指定すると、データの各点に異なる色を付けられる) -
opacity: 透過度 (0〜1)
さいごに
3Dで散布図を作りたくていろいろ試してみました。
個人的には、plotlyを使った方法が好きかも(好きな角度に動かせるので見やすい)。
Google Colaboratoryにはあまり関係のない内容が多くなってしまいましたが、Colabの環境でやってみてできた!っていう経験談として残しておきます。

