概要
目黒区のラーメン店をneo4jで地図表示させてみます。
地図にラーメン店の位置を表示させるだけであれば、グラフデータベース使う必要ないですが、neo4jでの地図表示の一例として表示させてみます。
目黒ラーメン店データ
ラーメン店データファイルは、以下に格納する必要があります。
/Users/ユーザ名/Library/Application Support/Neo4j Desktop/Application/relate-data/dbmss/dbms-******データベース毎に異なる/import
目黒区のラーメン店データファイル(ここでは、place1.csv)は、
位置ID、店名、店舗タイプ(ラーメン)、緯度、経度
データが80件のデータとします。
neo4jへの取り込み
それでは、まずはインデックスを作成します。
create index on :Place(id);
create index on :Place(location);
create index on :Place(name);
続いて、ラーメン店データファイルを読み込みます。
load csv with headers from
"file:///place1.csv" as csv
create (p:Place {id: csv.PlaceId, name:csv.PlaceName, type:csv.PlaceType, location:point({x: toFloat(csv.Lat), y: toFloat(csv.Long)})});
地図表示用のNeomapのインストール
ここでは地図表示用のNeomapをインストールします。
Neo4j Desktopの「Graph Apps」の「Install」に「https://registry.npmjs.org/neomap」と入力してインストールします。(下はインストール後)
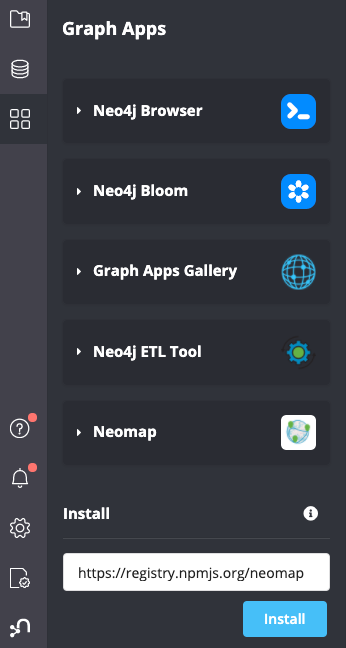
インストール後、上記のNeoMapをクリックして、Neomapアプリを起動します。
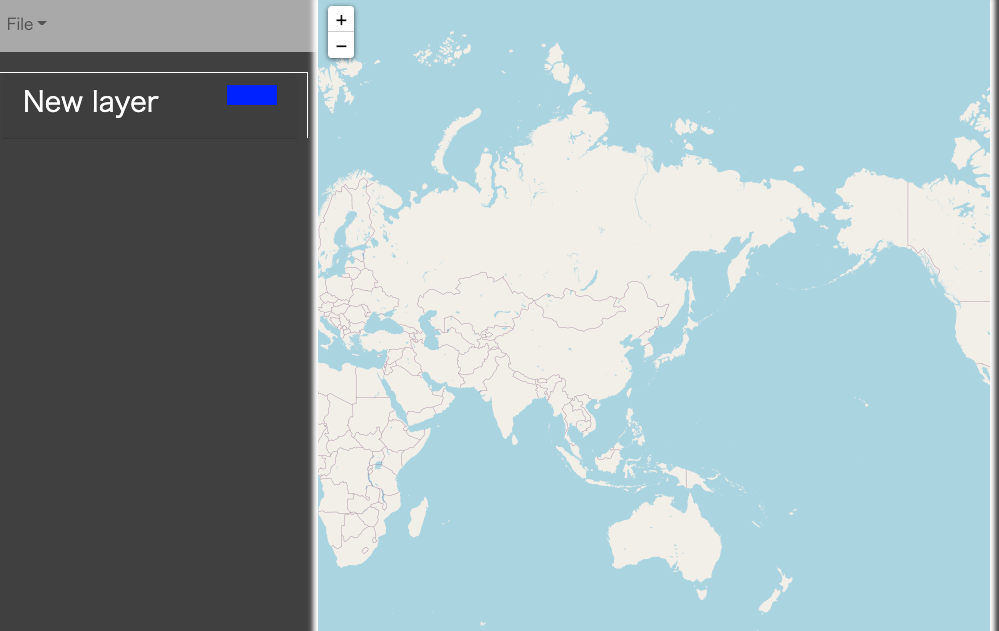
地図表示
New layerをクリックして、
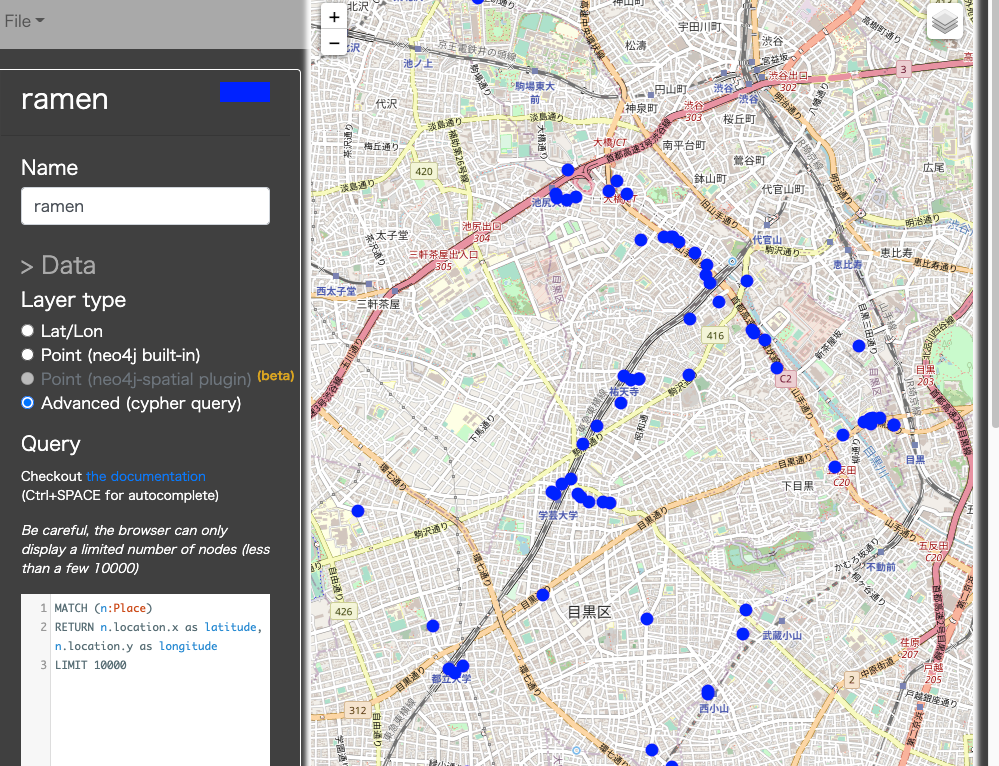
・Nmae : ramen
・Layer type : Advanced(cypher query)
・Query :
MATCH (n:Place)
RETURN n.location.x as latitude, n.location.y as longitude
LIMIT 100
・Rendering : Markers
上記設定をして、「Update map」ボタンをクリックします。目黒区のラーメン店が青点で表示されます。
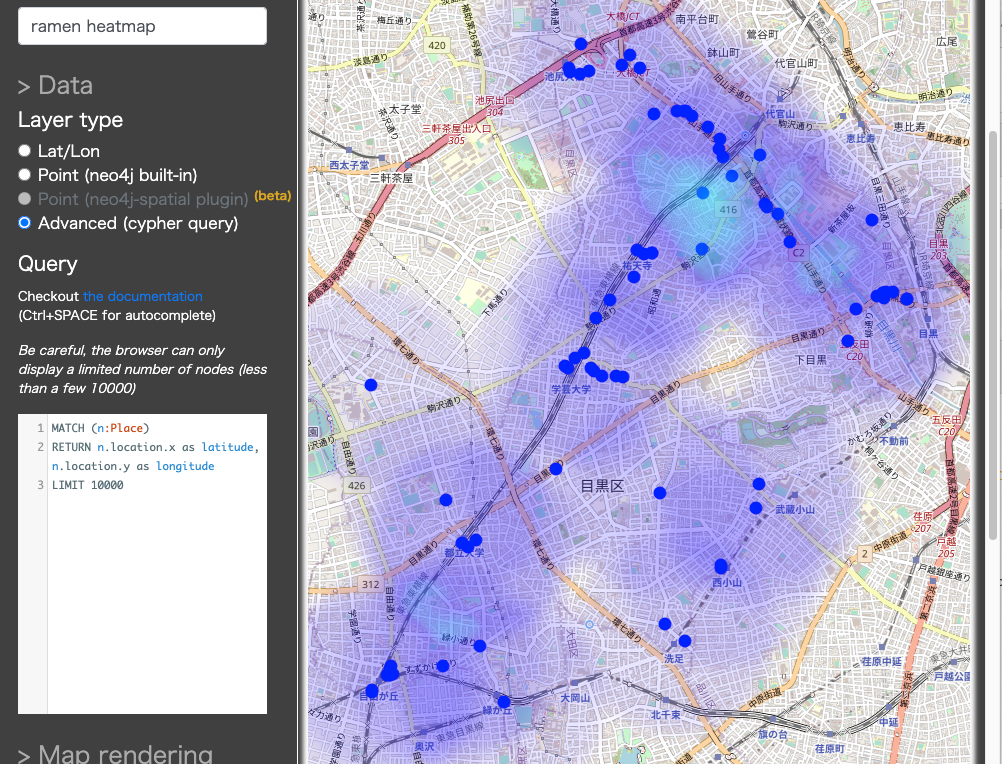
続いて、「New Layer」をクリックして、
・Nmae : ramen heatmap
・Layer type : Advanced(cypher query)
・Query :
MATCH (n:Place)
RETURN n.location.x as latitude, n.location.y as longitude
LIMIT 100
・Rendering : Heatmap
上記設定をして、「Update map」ボタンをクリックします。新しいレイヤーに目黒区のラーメン店のヒートマップが重ねて表示されます。
簡単に地図表示できましたね。