はじめに
稼働中のEC2インスタンスについて、インスタンスのモニタリングやCloudWatchではCPU使用率、ネットワーク送受信量、ディスク読み書きなど、限られたリソース情報しか確認する事ができません。
また、OS(Windows)の障害やセキュリティ的に注意が必要なイベントが発生した場合も、インスタンスにリモートデスクトップ接続をするなどして、Windowsのイベントログなどを確認する必要があります。
SystemsManagerの管理下にあるインスタンスについては、フリートマネージャーやセッションマネージャーでインスタンスにアクセスして、OSのパフォーマンス状況(Windowsであればパフォーマンスモニターのカウンター)、Sysログ(Windowsの場合イベントログ)などを確認する事ができますが、多くのインスタンスが稼働している環境では、これではまともに運用監視する事ができません。
以前は、Zabbixなどをインスタンスに入れてEC2インスタンスの運用監視をしたりしていましたが、現状では、SystemsManagerやCloudWatchエージェントを利用する事で、CloudWatchに各インスタンスのログを集約して簡易的な監視であればできるようになっています。
今回は、EC2上で稼働しているWindowsサーバーについて、CloudWatchエージェントを利用し、Windowsのイベントログ、Microsoft Defenderのイベントログ、パフォーマンスカウンターの情報をCloudWatchに転送して監視する方法について記載してみます。
前提
SystemsManagerを利用し、CloudWatchエージェントのインストールおよびエージェントの更新ができるようになっている事を前提としています。
CloudWatchエージェントの設定
SessionManagerなどで、SystemsManagerの管理下にあるEC2インスタンスに接続し、PowerShellでCloudWatchエージェントの設定を行います。
以下に、ウィザード形式でCloudWatchエージェントの設定ができるツールがあるので、このツールを実行してCloudWatchエージェントの設定を行います。
PS C:\Program Files\Amazon\AmazonCloudWatchAgent> .\amazon-cloudwatch-agent-config-wizard.exe
SystemsManagerのパラメータストアで直接JSON形式でCloudWatchエージェントの設定を記載し、その内容をSystemsManagerの管理下にあるインスタンスに適用する事もできます。
ウィザードでは、以下のような選択をしていきます。
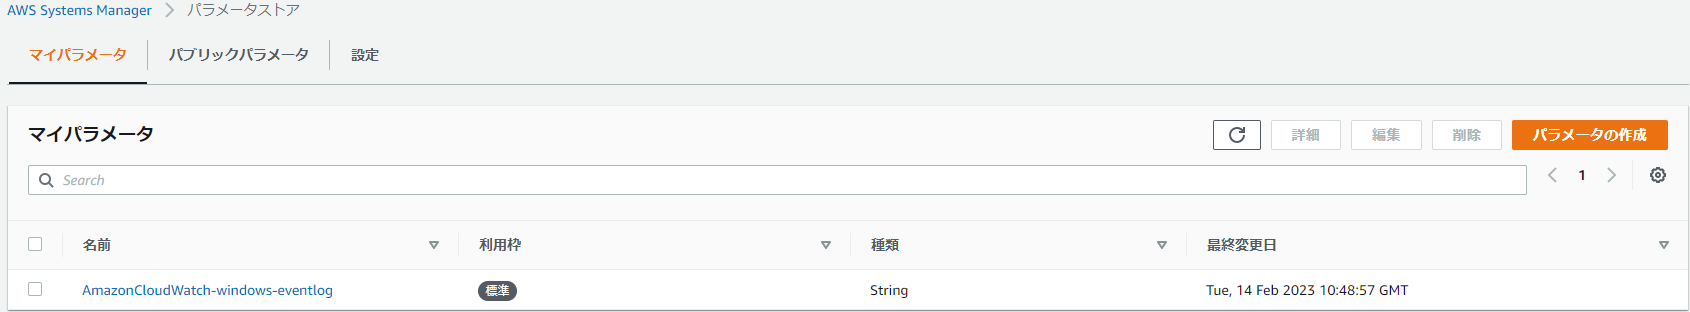
この例では、「System」、「Security」、「Microsoft Defender」のイベントログとパフォーマンスカウンター(メトリクスセット「Advanced」で定義されているもの)の情報をCloudWatchのロググループおよびメトリクスに転送する設定を行い、設定内容を「AmazonCloudWatch-windows-eventlog」という名前でSystemsManagerのパラメータストアに保存しています。
なお、Microsoft Defenderなど、SystemやSecurityといったWindowsイベントログ以外のログをCloudWatchに出力したい場合については、以下を参照するとよいと思います。
CloudWatchエージェントのConfigウィザード設定
PS C:\Program Files\Amazon\AmazonCloudWatchAgent> .\amazon-cloudwatch-agent-config-wizard.exe
================================================================
= Welcome to the Amazon CloudWatch Agent Configuration Manager =
= =
= CloudWatch Agent allows you to collect metrics and logs from =
= your host and send them to CloudWatch. Additional CloudWatch =
= charges may apply. =
================================================================
On which OS are you planning to use the agent?
1. linux
2. windows
3. darwin
default choice: [2]:
2
Trying to fetch the default region based on ec2 metadata...
Are you using EC2 or On-Premises hosts?
1. EC2
2. On-Premises
default choice: [1]:
1
Do you want to turn on StatsD daemon?
1. yes
2. no
default choice: [1]:
1
Which port do you want StatsD daemon to listen to?
default choice: [8125]
What is the collect interval for StatsD daemon?
1. 10s
2. 30s
3. 60s
default choice: [1]:
What is the aggregation interval for metrics collected by StatsD daemon?
1. Do not aggregate
2. 10s
3. 30s
4. 60s
default choice: [4]:
Do you have any existing CloudWatch Log Agent configuration file to import for migration?
1. yes
2. no
default choice: [2]:
Do you want to monitor any host metrics? e.g. CPU, memory, etc.
1. yes
2. no
default choice: [1]:
Do you want to monitor cpu metrics per core?
1. yes
2. no
default choice: [1]:
Do you want to add ec2 dimensions (ImageId, InstanceId, InstanceType, AutoScalingGroupName) into all of your metrics if the info is available?
1. yes
2. no
default choice: [1]:
Do you want to aggregate ec2 dimensions (InstanceId)?
1. yes
2. no
default choice: [1]:
Would you like to collect your metrics at high resolution (sub-minute resolution)? This enables sub-minute resolution for all metrics, but you can customize for specific metrics in the output json file.
1. 1s
2. 10s
3. 30s
4. 60s
default choice: [4]:
Which default metrics config do you want?
1. Basic
2. Standard
3. Advanced
4. None
default choice: [1]:
3
Current config as follows:
{
"metrics": {
"aggregation_dimensions": [
[
"InstanceId"
]
],
"append_dimensions": {
"AutoScalingGroupName": "${aws:AutoScalingGroupName}",
"ImageId": "${aws:ImageId}",
"InstanceId": "${aws:InstanceId}",
"InstanceType": "${aws:InstanceType}"
},
"metrics_collected": {
"LogicalDisk": {
"measurement": [
"% Free Space"
],
"metrics_collection_interval": 60,
"resources": [
"*"
]
},
"Memory": {
"measurement": [
"% Committed Bytes In Use"
],
"metrics_collection_interval": 60
},
"Paging File": {
"measurement": [
"% Usage"
],
"metrics_collection_interval": 60,
"resources": [
"*"
]
},
"PhysicalDisk": {
"measurement": [
"% Disk Time",
"Disk Write Bytes/sec",
"Disk Read Bytes/sec",
"Disk Writes/sec",
"Disk Reads/sec"
],
"metrics_collection_interval": 60,
"resources": [
"*"
]
},
"Processor": {
"measurement": [
"% User Time",
"% Idle Time",
"% Interrupt Time"
],
"metrics_collection_interval": 60,
"resources": [
"*"
]
},
"TCPv4": {
"measurement": [
"Connections Established"
],
"metrics_collection_interval": 60
},
"TCPv6": {
"measurement": [
"Connections Established"
],
"metrics_collection_interval": 60
},
"statsd": {
"metrics_aggregation_interval": 60,
"metrics_collection_interval": 10,
"service_address": ":8125"
}
}
}
}
Are you satisfied with the above config? Note: it can be manually customized after the wizard completes to add additional items.
1. yes
2. no
default choice: [1]:
Do you want to monitor any customized log files?
1. yes
2. no
default choice: [1]:
2
Do you want to monitor any Windows event log?
1. yes
2. no
default choice: [1]:
Windows event log name:
default choice: [System]
Do you want to monitor VERBOSE level events for Windows event log System ?
1. yes
2. no
default choice: [1]:
Do you want to monitor INFORMATION level events for Windows event log System ?
1. yes
2. no
default choice: [1]:
Do you want to monitor WARNING level events for Windows event log System ?
1. yes
2. no
default choice: [1]:
Do you want to monitor ERROR level events for Windows event log System ?
1. yes
2. no
default choice: [1]:
Do you want to monitor CRITICAL level events for Windows event log System ?
1. yes
2. no
default choice: [1]:
Log group name:
default choice: [System]
Windows-System-Event-Log
Log stream name:
default choice: [{instance_id}]
In which format do you want to store windows event to CloudWatch Logs?
1. XML: XML format in Windows Event Viewer
2. Plain Text: Legacy CloudWatch Windows Agent (SSM Plugin) Format
default choice: [1]:
Log Group Retention in days
1. -1
2. 1
3. 3
4. 5
5. 7
6. 14
7. 30
8. 60
9. 90
10. 120
11. 150
12. 180
13. 365
14. 400
15. 545
16. 731
17. 1827
18. 2192
19. 2557
20. 2922
21. 3288
22. 3653
default choice: [1]:
7
Do you want to specify any additional Windows event log to monitor?
1. yes
2. no
default choice: [1]:
Windows event log name:
default choice: [System]
Security
Do you want to monitor VERBOSE level events for Windows event log Security ?
1. yes
2. no
default choice: [1]:
Do you want to monitor INFORMATION level events for Windows event log Security ?
1. yes
2. no
default choice: [1]:
Do you want to monitor WARNING level events for Windows event log Security ?
1. yes
2. no
default choice: [1]:
Do you want to monitor ERROR level events for Windows event log Security ?
1. yes
2. no
default choice: [1]:
Do you want to monitor CRITICAL level events for Windows event log Security ?
1. yes
2. no
default choice: [1]:
Log group name:
default choice: [Security]
Windows-Security-Event-Log
Log stream name:
default choice: [{instance_id}]
In which format do you want to store windows event to CloudWatch Logs?
1. XML: XML format in Windows Event Viewer
2. Plain Text: Legacy CloudWatch Windows Agent (SSM Plugin) Format
default choice: [1]:
Log Group Retention in days
1. -1
2. 1
3. 3
4. 5
5. 7
6. 14
7. 30
8. 60
9. 90
10. 120
11. 150
12. 180
13. 365
14. 400
15. 545
16. 731
17. 1827
18. 2192
19. 2557
20. 2922
21. 3288
22. 3653
default choice: [1]:
Do you want to specify any additional Windows event log to monitor?
1. yes
2. no
default choice: [1]:
Windows event log name:
default choice: [System]
Microsoft-Windows-Windows Defender/Operational
Do you want to monitor VERBOSE level events for Windows event log Microsoft-Windows-Windows Defender/Operational ?
1. yes
2. no
default choice: [1]:
Do you want to monitor INFORMATION level events for Windows event log Microsoft-Windows-Windows Defender/Operational ?
1. yes
2. no
default choice: [1]:
Do you want to monitor WARNING level events for Windows event log Microsoft-Windows-Windows Defender/Operational ?
1. yes
2. no
default choice: [1]:
Do you want to monitor ERROR level events for Windows event log Microsoft-Windows-Windows Defender/Operational ?
1. yes
2. no
default choice: [1]:
Do you want to monitor CRITICAL level events for Windows event log Microsoft-Windows-Windows Defender/Operational ?
1. yes
2. no
default choice: [1]:
Log group name:
default choice: [Microsoft-Windows-Windows Defender/Operational]
Microsoft-Defender-Log
Log stream name:
default choice: [{instance_id}]
In which format do you want to store windows event to CloudWatch Logs?
1. XML: XML format in Windows Event Viewer
2. Plain Text: Legacy CloudWatch Windows Agent (SSM Plugin) Format
default choice: [1]:
Log Group Retention in days
1. -1
2. 1
3. 3
4. 5
5. 7
6. 14
7. 30
8. 60
9. 90
10. 120
11. 150
12. 180
13. 365
14. 400
15. 545
16. 731
17. 1827
18. 2192
19. 2557
20. 2922
21. 3288
22. 3653
default choice: [1]:
Do you want to specify any additional Windows event log to monitor?
1. yes
2. no
default choice: [1]:
2
Saved config file to config.json successfully.
Current config as follows:
{
"logs": {
"logs_collected": {
"windows_events": {
"collect_list": [
{
"event_format": "xml",
"event_levels": [
"VERBOSE",
"INFORMATION",
"WARNING",
"ERROR",
"CRITICAL"
],
"event_name": "System",
"log_group_name": "System",
"log_stream_name": "{instance_id}",
"retention_in_days": 30
},
{
"event_format": "xml",
"event_levels": [
"VERBOSE",
"INFORMATION",
"WARNING",
"ERROR",
"CRITICAL"
],
"event_name": "Security",
"log_group_name": "Security",
"log_stream_name": "{instance_id}",
"retention_in_days": -1
},
{
"event_format": "xml",
"event_levels": [
"VERBOSE",
"INFORMATION",
"WARNING",
"ERROR",
"CRITICAL"
],
"event_name": "Microsoft-Windows-Windows Defender/Operational",
"log_group_name": "Microsoft-Defender-Log",
"log_stream_name": "{instance_id}",
"retention_in_days": -1
}
]
}
}
},
"metrics": {
"aggregation_dimensions": [
[
"InstanceId"
]
],
"append_dimensions": {
"AutoScalingGroupName": "${aws:AutoScalingGroupName}",
"ImageId": "${aws:ImageId}",
"InstanceId": "${aws:InstanceId}",
"InstanceType": "${aws:InstanceType}"
},
"metrics_collected": {
"LogicalDisk": {
"measurement": [
"% Free Space"
],
"metrics_collection_interval": 60,
"resources": [
"*"
]
},
"Memory": {
"measurement": [
"% Committed Bytes In Use"
],
"metrics_collection_interval": 60
},
"Paging File": {
"measurement": [
"% Usage"
],
"metrics_collection_interval": 60,
"resources": [
"*"
]
},
"PhysicalDisk": {
"measurement": [
"% Disk Time",
"Disk Write Bytes/sec",
"Disk Read Bytes/sec",
"Disk Writes/sec",
"Disk Reads/sec"
],
"metrics_collection_interval": 60,
"resources": [
"*"
]
},
"Processor": {
"measurement": [
"% User Time",
"% Idle Time",
"% Interrupt Time"
],
"metrics_collection_interval": 60,
"resources": [
"*"
]
},
"TCPv4": {
"measurement": [
"Connections Established"
],
"metrics_collection_interval": 60
},
"TCPv6": {
"measurement": [
"Connections Established"
],
"metrics_collection_interval": 60
},
"statsd": {
"metrics_aggregation_interval": 60,
"metrics_collection_interval": 10,
"service_address": ":8125"
}
}
}
}
Please check the above content of the config.
The config file is also located at config.json.
Edit it manually if needed.
Do you want to store the config in the SSM parameter store?
1. yes
2. no
default choice: [1]:
What parameter store name do you want to use to store your config? (Use 'AmazonCloudWatch-' prefix if you use our managed AWS policy)
default choice: [AmazonCloudWatch-windows]
AmazonCloudWatch-windows-eventlog
Trying to fetch the default region based on ec2 metadata...
Which region do you want to store the config in the parameter store?
default choice: [ap-northeast-1]
Which AWS credential should be used to send json config to parameter store?
1. XXXXXXXXXXXXXXXXXXXX(From SDK)
2. Other
default choice: [1]:
Successfully put config to parameter store AmazonCloudWatch-windows-eventlog.
Please press Enter to exit...
Program exits now.
PS C:\Program Files\Amazon\AmazonCloudWatchAgent>
上記設定により、設定したインスタンスのC:\Program Files\Amazon\AmazonCloudWatchAgent\config.jsonファイルおよびSystemsManagerのパラメータストアにCloudWatchエージェントの設定内容が保管されます。
ウィザードにより生成されたCloudWatchエージェントの設定は、上記例では以下のようになります。
{
	"logs": {
		"logs_collected": {
			"windows_events": {
				"collect_list": [
					{
						"event_format": "xml",
						"event_levels": [
							"VERBOSE",
							"INFORMATION",
							"WARNING",
							"ERROR",
							"CRITICAL"
						],
						"event_name": "System",
						"log_group_name": "Windows-System-Event-Log",
						"log_stream_name": "{instance_id}",
						"retention_in_days": 30
					},
					{
						"event_format": "xml",
						"event_levels": [
							"VERBOSE",
							"INFORMATION",
							"WARNING",
							"ERROR",
							"CRITICAL"
						],
						"event_name": "Security",
						"log_group_name": "Windows-Security-Event-Log",
						"log_stream_name": "{instance_id}",
						"retention_in_days": -1
					},
					{
						"event_format": "xml",
						"event_levels": [
							"VERBOSE",
							"INFORMATION",
							"WARNING",
							"ERROR",
							"CRITICAL"
						],
						"event_name": "Microsoft-Windows-Windows Defender/Operational",
						"log_group_name": "Microsoft-Defender-Log",
						"log_stream_name": "{instance_id}",
						"retention_in_days": -1
					}
				]
			}
		}
	},
	"metrics": {
		"aggregation_dimensions": [
			[
				"InstanceId"
			]
		],
		"append_dimensions": {
			"AutoScalingGroupName": "${aws:AutoScalingGroupName}",
			"ImageId": "${aws:ImageId}",
			"InstanceId": "${aws:InstanceId}",
			"InstanceType": "${aws:InstanceType}"
		},
		"metrics_collected": {
			"LogicalDisk": {
				"measurement": [
					"% Free Space"
				],
				"metrics_collection_interval": 60,
				"resources": [
					"*"
				]
			},
			"Memory": {
				"measurement": [
					"% Committed Bytes In Use"
				],
				"metrics_collection_interval": 60
			},
			"Paging File": {
				"measurement": [
					"% Usage"
				],
				"metrics_collection_interval": 60,
				"resources": [
					"*"
				]
			},
			"PhysicalDisk": {
				"measurement": [
					"% Disk Time",
					"Disk Write Bytes/sec",
					"Disk Read Bytes/sec",
					"Disk Writes/sec",
					"Disk Reads/sec"
				],
				"metrics_collection_interval": 60,
				"resources": [
					"*"
				]
			},
			"Processor": {
				"measurement": [
					"% User Time",
					"% Idle Time",
					"% Interrupt Time"
				],
				"metrics_collection_interval": 60,
				"resources": [
					"*"
				]
			},
			"TCPv4": {
				"measurement": [
					"Connections Established"
				],
				"metrics_collection_interval": 60
			},
			"TCPv6": {
				"measurement": [
					"Connections Established"
				],
				"metrics_collection_interval": 60
			},
			"statsd": {
				"metrics_aggregation_interval": 60,
				"metrics_collection_interval": 10,
				"service_address": ":8125"
			}
		}
	}
}
CloudWatch エージェントを使用してメトリクスとログを収集する方法については、以下のマニュアルも参照ください。
上記マニュアルより、ウィザードで選択できる、パフォーマンスカウンターのメトリクスセットを選択する事により、取得したいパフォーマンスカウンターのメトリクスを指定する事ができます。
CloudWatch エージェントの事前定義されたメトリクスセット
ウィザードは、異なる詳細レベルを持つ、事前定義されたメトリクスセットで設定されます。これらのメトリクスのセットを次の表に示します。これらのメトリクスの詳細については、CloudWatch エージェントにより収集されるメトリクスを参照してください。
Windowsサーバーが実行されているEC2インスタンスでは、メトリクスセットの種類により、以下のようなメトリクスについて情報が収集されるようになります。
インスタンスのモニタリングやCloudWatchのメトリクスにデフォルトで含まれていないメモリ使用量、ディスク空き容量(%)についても確認できるようになるため、運用する際には有用だと思います。
| メトリクスセットの種類 | 含まれるメトリクス |
|---|---|
| Basic | 【Memory】 Memory % Committed Bytes In Use 【LogicalDisk】 LogicalDisk % Free Space |
| Standard | 【Memory】 Memory % Committed Bytes In Use 【Paging】 Paging File % Usage 【Processor】 Processor % Idle Time、Processor % Interrupt Time、Processor % User Time 【PhysicalDisk】 PhysicalDisk % Disk Time 【LogicalDisk】 LogicalDisk % Free Space |
| Advanced | 【Memory】 Memory % Committed Bytes In Use 【Paging】 Paging File % Usage 【Processor】 Processor % Idle Time、Processor % Interrupt Time、Processor % User Time 【LogicalDisk】 LogicalDisk % Free Space 【PhysicalDisk】 PhysicalDisk % Disk Time、PhysicalDisk Disk Write Bytes/sec、PhysicalDisk Disk Read Bytes/sec、PhysicalDisk Disk Writes/sec、PhysicalDisk Disk Reads/sec 【TCP】 TCPv4 Connections Established、 TCPv6 Connections Established |
メトリクスセットに含まれていないメトリクスについても収集したい場合は、CloudWatchエージェントのconfig(json)を手動で編集して設定する事も可能です。
上記マニュアルに記載の設定例を以下にも記載します。
Windows Server で使用する metrics セクションの例を次に示します。この例では、多くの Windows メトリクスが収集され、コンピュータは StatsD クライアントから追加のメトリクスを受信するように設定されています。
収集メトリクスの手動設定例
"metrics": {
    "metrics_collected": {
      "statsd": {},
      "Processor": {
        "measurement": [
          {"name": "% Idle Time", "rename": "CPU_IDLE", "unit": "Percent"},
          "% Interrupt Time",
          "% User Time",
          "% Processor Time"
        ],
        "resources": [
          "*"
        ],
        "append_dimensions": {
          "d1": "win_foo",
          "d2": "win_bar"
        }
      },
      "LogicalDisk": {
        "measurement": [
          {"name": "% Idle Time", "unit": "Percent"},
          {"name": "% Disk Read Time", "rename": "DISK_READ"},
          "% Disk Write Time"
        ],
        "resources": [
          "*"
        ]
      },
      "Memory": {
        "metrics_collection_interval": 5,
        "measurement": [
          "Available Bytes",
          "Cache Faults/sec",
          "Page Faults/sec",
          "Pages/sec"
        ],
        "append_dimensions": {
          "d3": "win_bo"
        }
      },
      "Network Interface": {
        "metrics_collection_interval": 5,
        "measurement": [
          "Bytes Received/sec",
          "Bytes Sent/sec",
          "Packets Received/sec",
          "Packets Sent/sec"
        ],
        "resources": [
          "*"
        ],
        "append_dimensions": {
          "d3": "win_bo"
        }
      },
      "System": {
        "measurement": [
          "Context Switches/sec",
          "System Calls/sec",
          "Processor Queue Length"
        ],
        "append_dimensions": {
          "d1": "win_foo",
          "d2": "win_bar"
        }
      }
    },
    "append_dimensions": {
      "ImageId": "${aws:ImageId}",
      "InstanceId": "${aws:InstanceId}",
      "InstanceType": "${aws:InstanceType}",
      "AutoScalingGroupName": "${aws:AutoScalingGroupName}"
    },
    "aggregation_dimensions" : [["ImageId"], ["InstanceId", "InstanceType"], ["d1"],[]]
    }
  }
CloudWatchエージェントの設定内容をEC2インスタンスに適用する
SystemsManagerのパラメータストアに保存したCloudWatchエージェントの設定(この例では、パラメータ名「AmazonCloudWatch-windows-eventlog」)をEC2インスタンスに適用します。
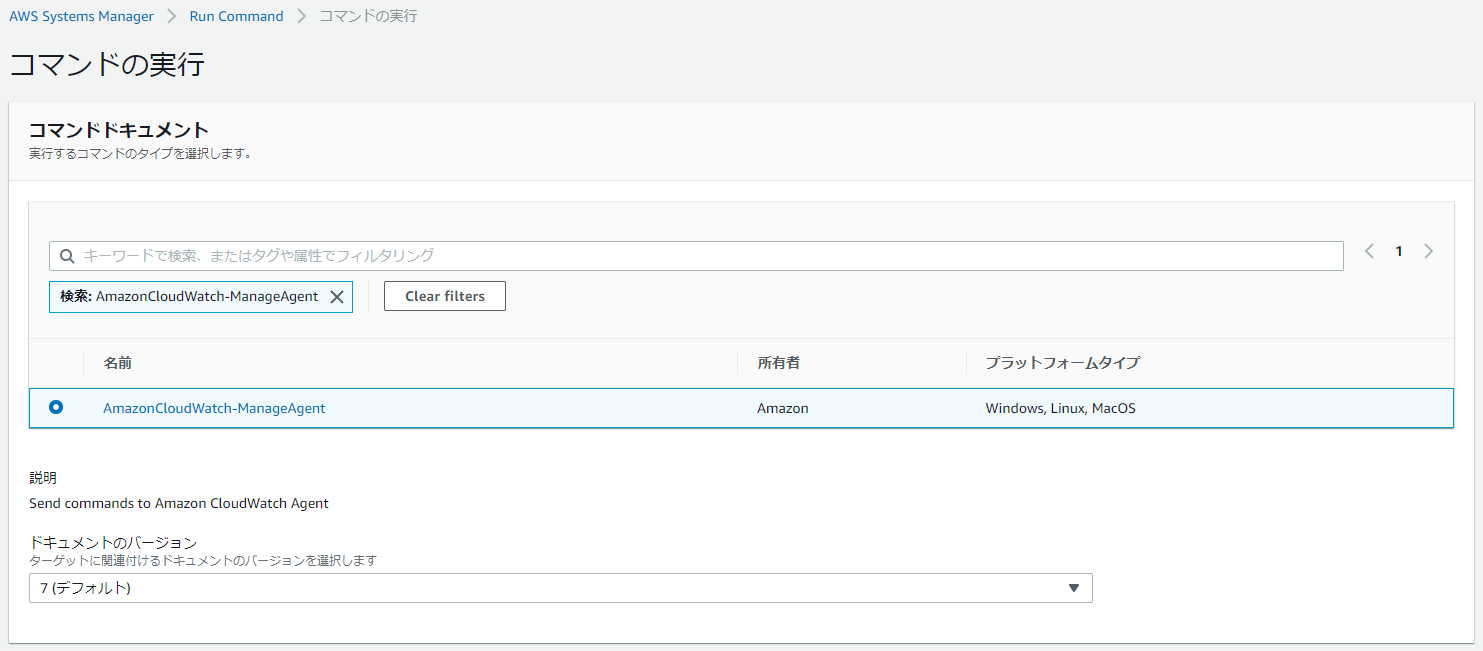
適用には、SystemsManagerのRun Commandを利用します。
「AWS Systems Manager」 -> 「Run Command」 -> 「コマンドの実行」に画面遷移し、コマンドのドキュメントから AmazonCloudWatch-ManageAgentにチェックをいれます。
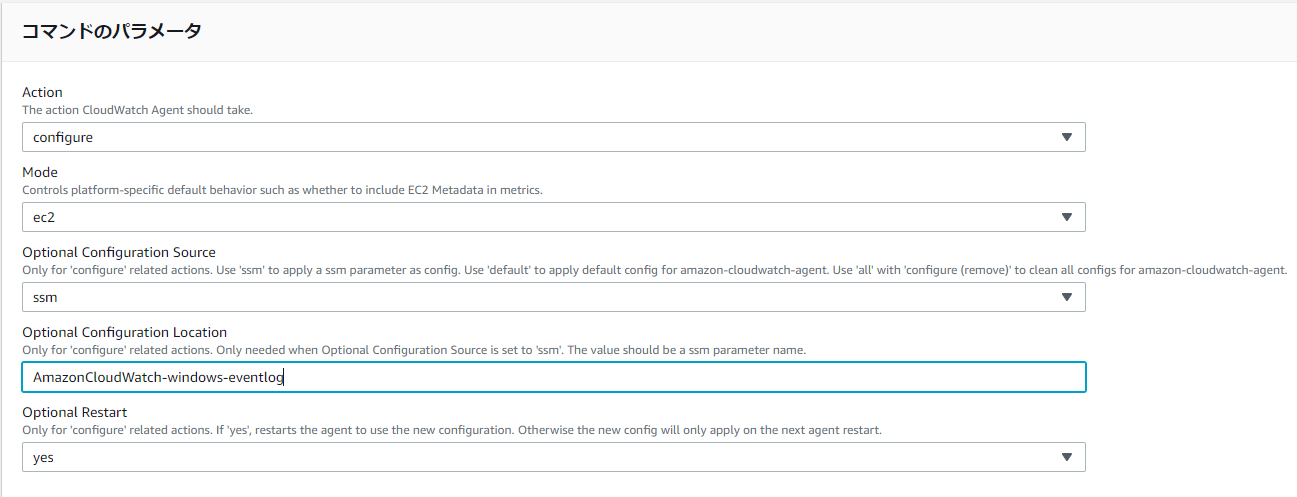
コマンドのパラメータでは、「Optional Configuration Location」という項目に、パラメータストアに保管したパラメータ「AmazonCloudWatch-windows-eventlog」を入力します。
次に、CloudWatchエージェントの設定を適用するインスタンスを選択します。
タグでの指定、インスタンスを手動で指定、リソースグループの選択ができますが、タグで選択できるようにしておくと運用上は便利だと思います。
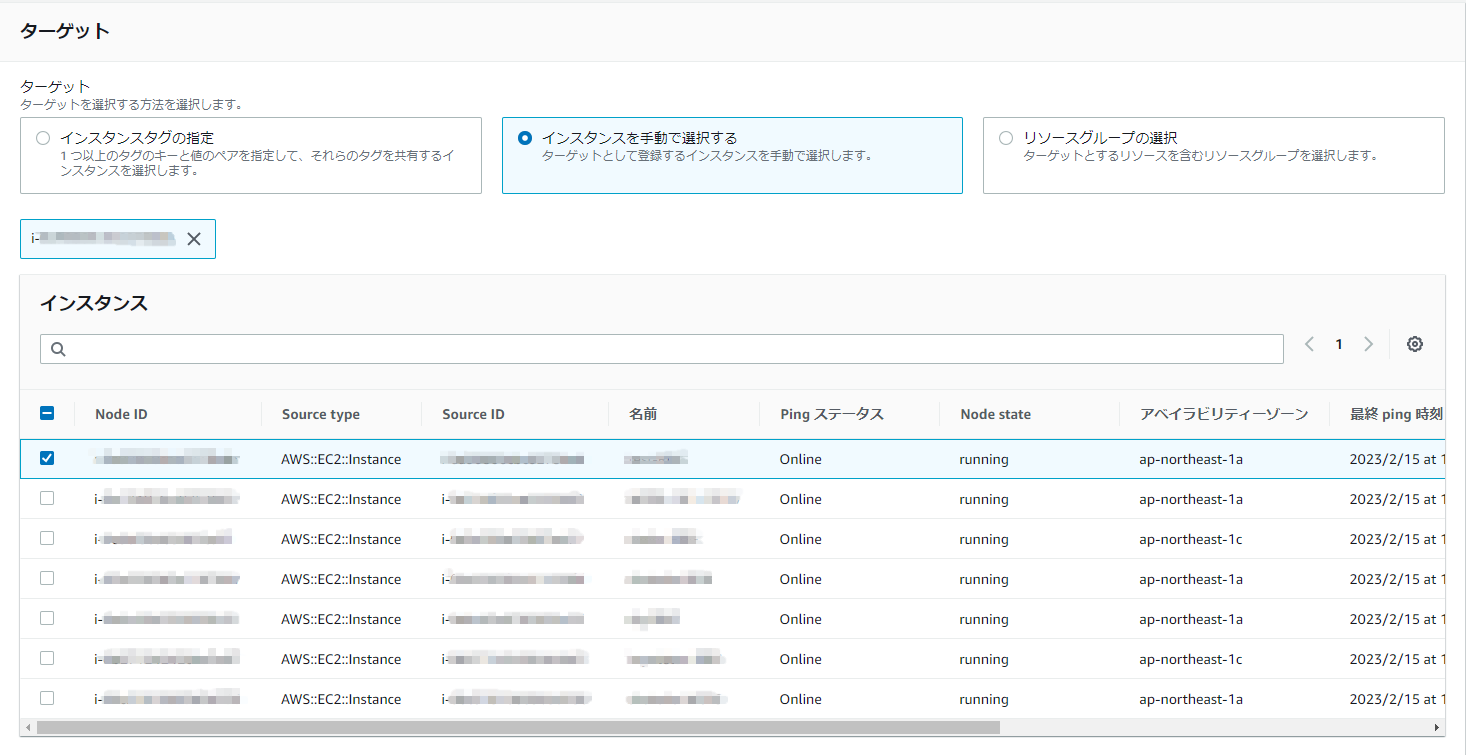
ターゲットの選択まで完了後、コマンドを実行する事で、ターゲットに指定したEC2インスタンスのCloudWatchエージェントの設定が更新されます。
Run CommandによりCloudWatchエージェントの設定が反映されると、CloudWatch Logsに指定したロググループが作成され、各ロググループにWindowsサーバーのイベントログの情報が出力されます。
今回の例では、WindowsのSystemイベントログ、Securityイベントログ、Microsoft Defenderのイベントログが出力されています。
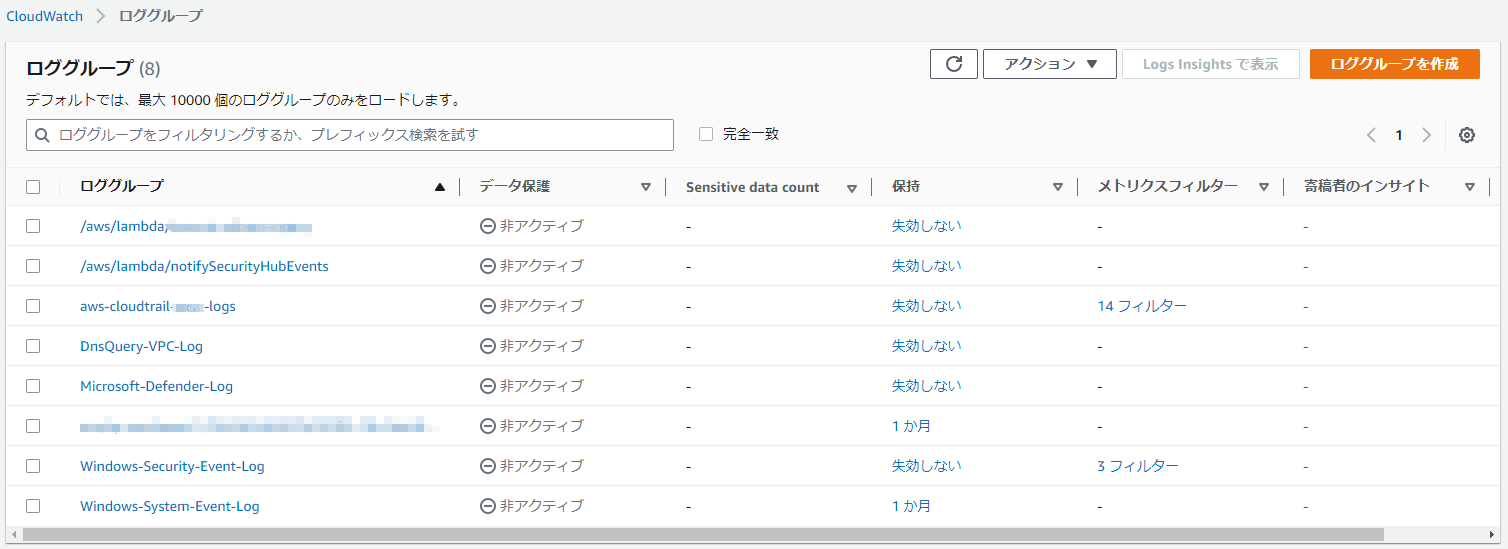
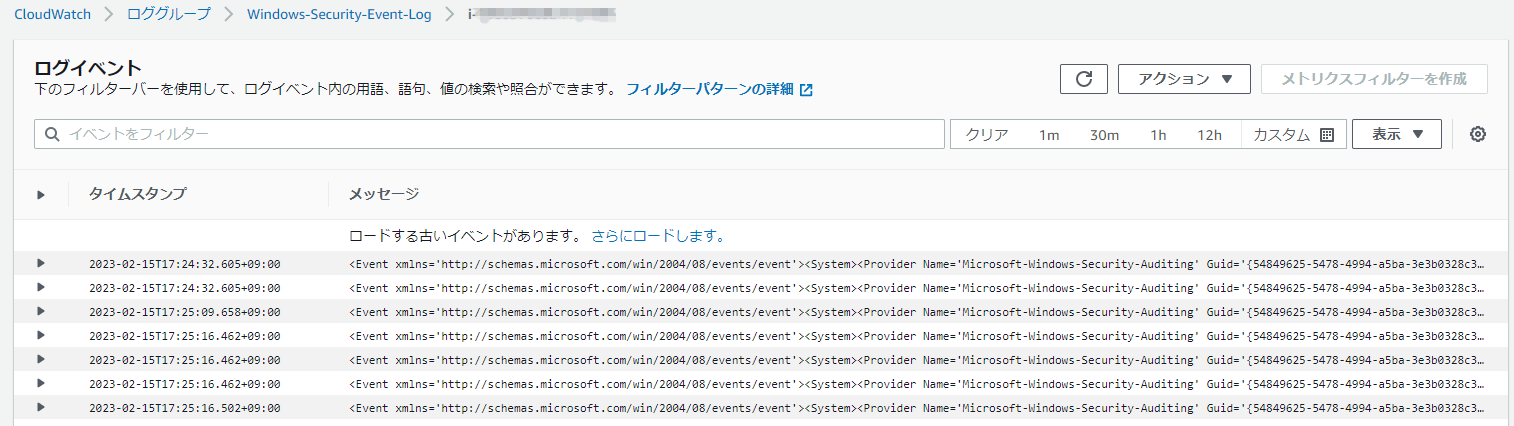
各ロググループには、インスタンスID毎にログがXML形式で出力されます。
※以下は、Systemイベントログの出力例
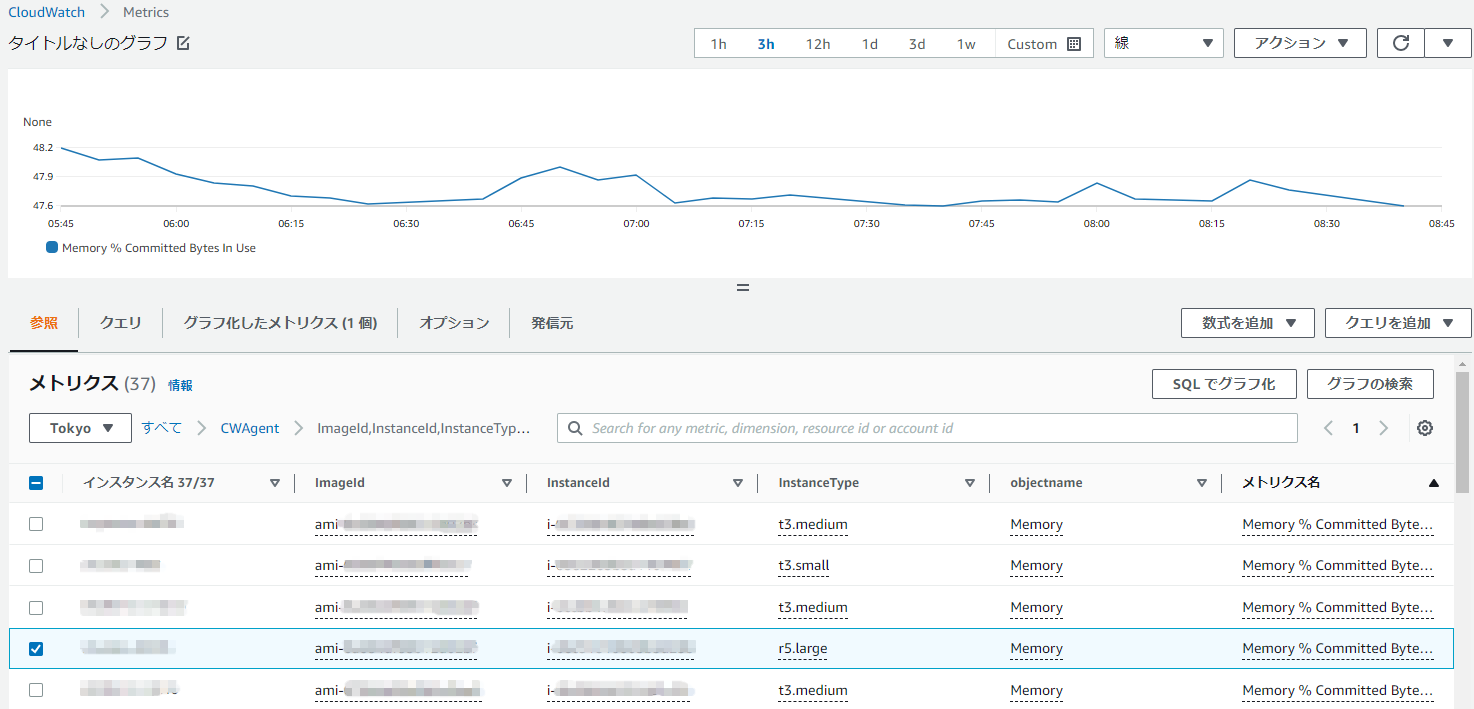
パフォーマンスカウンターの情報は、メトリクスの「CWAgent」というカスタム名前空間に出力されます。
※以下は、Memory%Committed Bytes In Useパフォーマンスカウンターの出力例
メトリクスフィルターとアラームの設定
EC2インスタンス(Windowsサーバー)のイベントログやパフォーマンスカウンターのメトリクスがCloudWatchに出力できるようになったら、監視や検知が必要なイベントを検知するために、メトリクスフィルター、アラーム設定を行い、メールやSlackなどへの通知設定をします(例えば、Systemイベントログでは、イベントログが「エラー」または「クリティカル」のイベントを通知するようにするなど)。
メトリクスフィルターおよびアラームの設定方法については、以下などを参照ください。
参考までに、Securityイベントログ、Microsoft Defenderのイベントログで、通知する事を検討したいイベントのフィルタ条件を記載します。
Securityイベントログ
| メッセージ | フィルターパターン |
|---|---|
| ネットワーク経由のログオン成功 | "<EventID>4624</EventID>" "<Data Name='LogonType'>3</Data>" |
| ネットワーク経由のログオン失敗 | "<EventID>4625</EventID>" "<Data Name='LogonType'>3</Data>" |
| RDPでのログオン成功 | "<EventID>4624</EventID>" "<Data Name='LogonType'>10</Data>" |
| RDPでのログオン失敗 | "<EventID>4625</EventID>" "<Data Name='LogonType'>10</Data>" |
| オブジェクトに対するハンドル要求 | "<EventID>4625</EventID>" "<Data Name='ObjectName'<C:\Documents\大切なファイル</Data>" |
| ユーザーアカウント作成 | "<EventID>4720</EventID>" |
| ユーザーアカウントパスワード変更 | "<EventID>4723</EventID>" |
| ユーザーアカウントパスワードリセット | "<EventID>4724</EventID>" |
| ユーザーアカウント無効化 | "<EventID>4725</EventID>" |
| ユーザーアカウント削除 | "<EventID>4726</EventID>" |
| ユーザーアカウントロック | "<EventID>4740</EventID>" |
| ローカルグループにメンバーが追加 | "<EventID>4732</EventID>" "<Data Name='TargetUserName'>Administrators</Data>" |
| 新しいログオンに特権が割り当て | "<EventID>4672</EventID>" |
Microsoft Defenderイベントログ
| メッセージ | フィルターパターン |
|---|---|
| マルウェア対策スキャンは終了する前に停止しました。 | "<EventID>1002</EventID>" |
| マルウェア対策スキャンが一時停止されました。 | "<EventID>1003</EventID>" |
| マルウェア対策スキャンに失敗しました。 | "<EventID>1005</EventID>" |
| マルウェア対策エンジンは、マルウェアや望ましくない可能性のある他のソフトウェアを検出しました。 | "<EventID>1006</EventID>" |
| マルウェア対策プラットフォームは、マルウェアなどの望ましくない可能性があるソフトウェアからシステムを保護するためのアクションを実行しようとしたが、アクションは失敗した。 | "<EventID>1008</EventID>" |
| マルウェア対策プラットフォームは、マルウェアなどの望ましくない可能性のあるソフトウェアの履歴を削除しました。 | "<EventID>1013</EventID>" |
| マルウェア対策プラットフォームでは、マルウェアなどの望ましくない可能性があるソフトウェアの履歴を削除する必要がありました。 | "<EventID>1014</EventID>" |
| マルウェア対策プラットフォームが疑わしい動作を検出しました。 | "<EventID>1015</EventID>" |
| マルウェア対策プラットフォームでは、マルウェアなどの望ましくない可能性のあるソフトウェアに対してアクションを実行しようとするときに重大なエラーが発生しました。イベント メッセージには詳細があります。 | "<EventID>1119</EventID>" |
| マルウェア対策エンジンの更新に失敗しました。 | "<EventID>2003</EventID>" |
| マルウェア対策定義の読み込み中に問題が発生しました。マルウェア対策エンジンは、最後に知られている一連の定義の読み込みを試みます。 | "<EventID>2004</EventID>" |
| マルウェア対策プラットフォームが最新ではないので、マルウェア対策エンジンの読み込みに失敗しました。マルウェア対策プラットフォームは、最後に知られている優れたマルウェア対策エンジンを読み込み、更新を試みる。 | "<EventID>2005</EventID>" |
| プラットフォームの更新に失敗しました。 | "<EventID>2006</EventID>" |
| マルウェア対策エンジンがクリーン ファイルのダウンロードに失敗しました。 | "<EventID>2021</EventID>" |
| マルウェア対策エンジンがオフライン スキャンをダウンロードして構成できなかった。 | "<EventID>2031</EventID>" |
| このオペレーティング システムバージョンのマルウェア対策のサポートは間もなく終了します。 | "<EventID>2040</EventID>" |
| このオペレーティング システムのマルウェア対策のサポートは終了しました。継続的なサポートのためにオペレーティング システムをアップグレードする必要があります。 | "<EventID>2041</EventID>" |
| マルウェア対策エンジンは、このオペレーティング システムをサポートしなくなったので、システムをマルウェアから保護しなくなりました。 | "<EventID>2042</EventID>" |
| リアルタイム保護でエラーが発生し、失敗しました。 | "<EventID>3002</EventID>" |
| リアルタイム保護は無効になっています。 | "<EventID>5001</EventID>" |
| リアルタイムの保護構成が変更されました。 | "<EventID>5004</EventID>" |
| マルウェア対策プラットフォームの構成が変更されました。 | "<EventID>5007</EventID>" |
| マルウェア対策エンジンでエラーが発生し、失敗しました。 | "<EventID>5008</EventID>" |
| ウイルスのスキャンは無効になっています。 | "<EventID>5012</EventID>" |
| マルウェア対策プラットフォームは間もなく期限切れになります。 | "<EventID>5100</EventID>" |
| マルウェア対策プラットフォームの有効期限が切れています。 | "<EventID>5101</EventID>" |
おわりに
SystemsManagerやCloudWatchエージェントを利用し、EC2上で稼働しているWindowsサーバーのWindowsイベントログ、Microsoft Defenderのイベントログ、パフォーマンスカウンターの情報をCloudWatchに転送して監視する方法について記載してみました。