やりたいこと
IoT Analyticsでは、AWS IoT Coreで取得したデータ以外に、BatchPutMessage を使って、データを取り込むことができます。
「実運用ではIoT Coreからのデータを解析したいが、すでにある過去のCSVデータを取り込んで、どういった可視化や解析が可能かを試してみたい」といったときに使えます。
今回、気象庁から東京の天気をCSVで取得して、それをQuickSightで可視化することを試します。
https://docs.aws.amazon.com/iotanalytics/latest/APIReference/API_BatchPutMessage.html
元データを入手
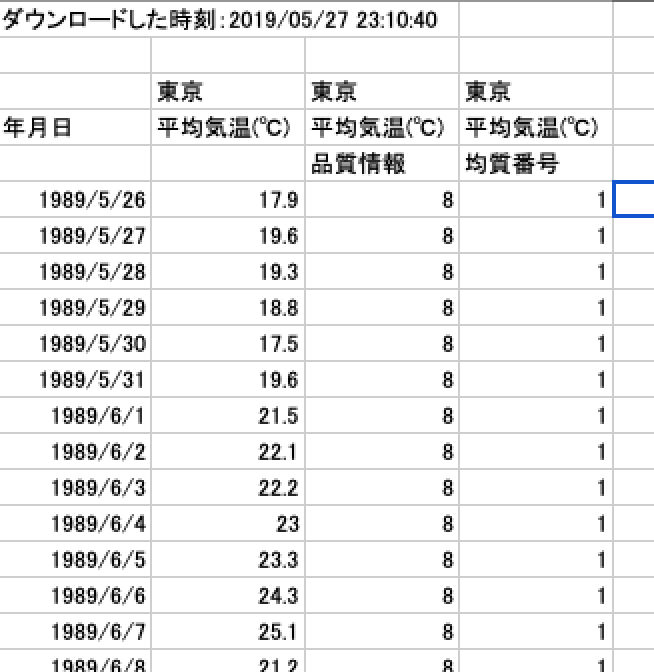
今回は、気象庁の過去の気象データを取得
https://www.data.jma.go.jp/gmd/risk/obsdl/
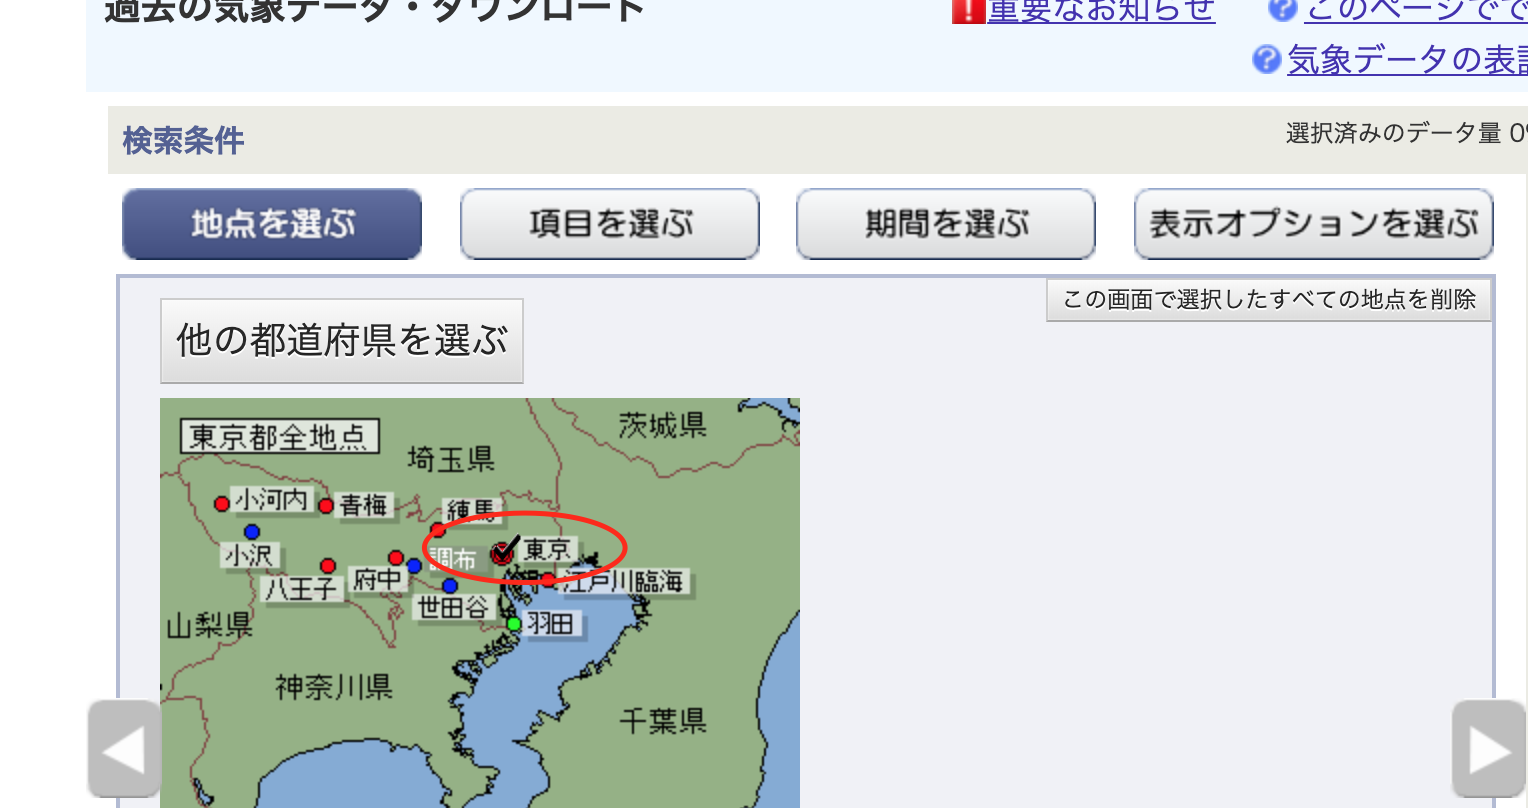
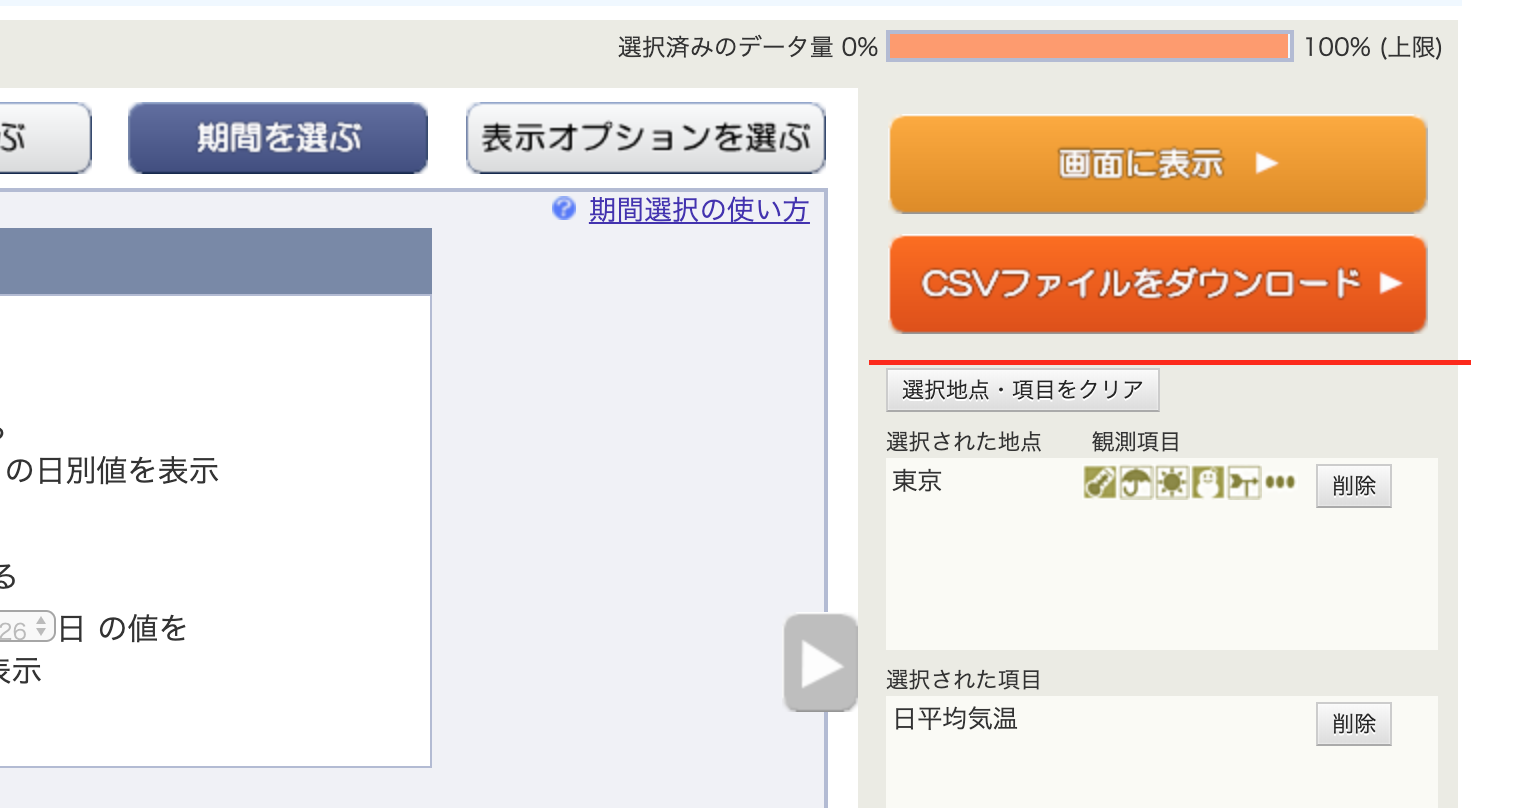
東京にチェックを入れる
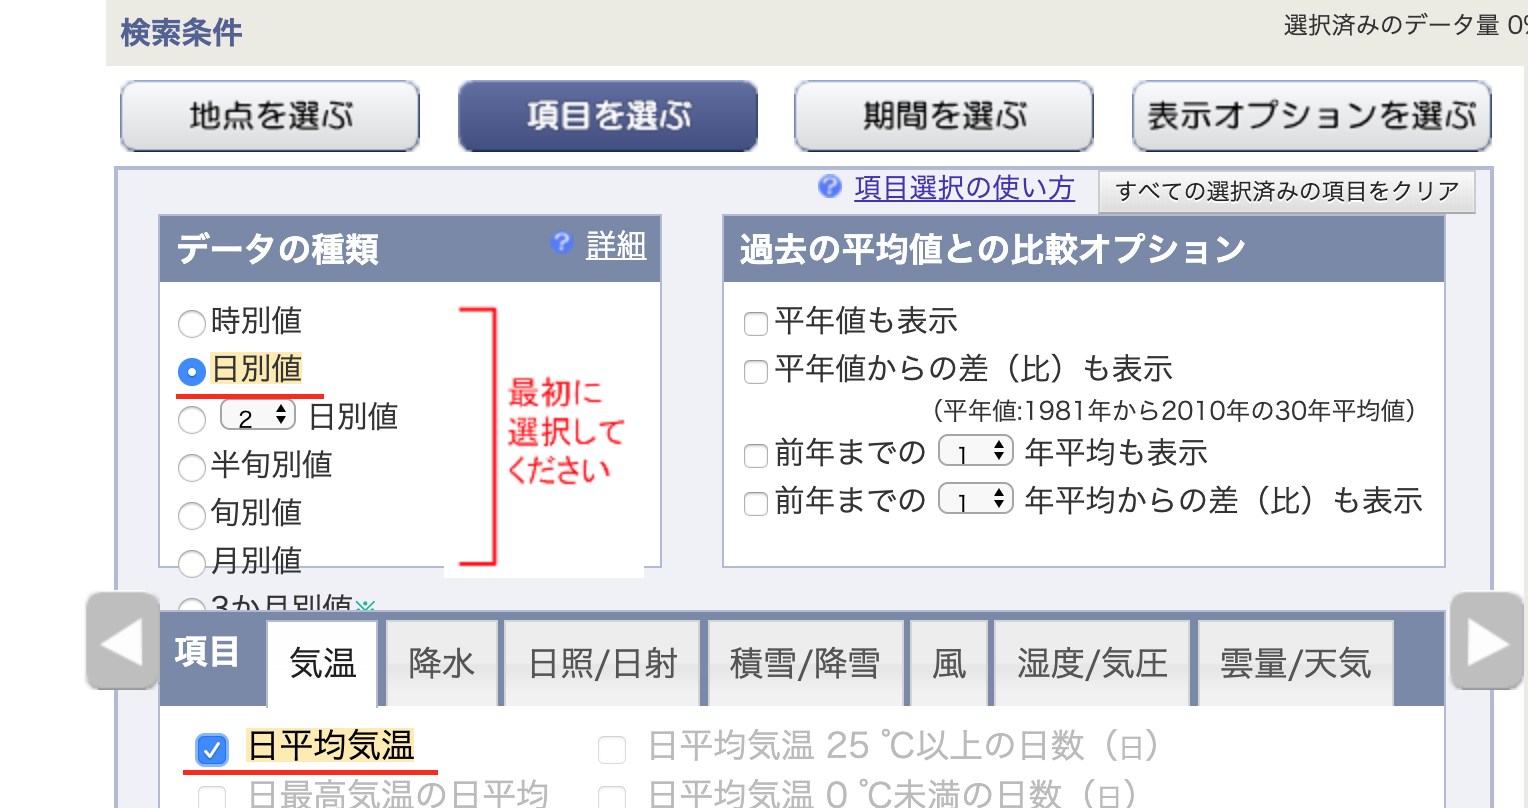
日別の平均気温
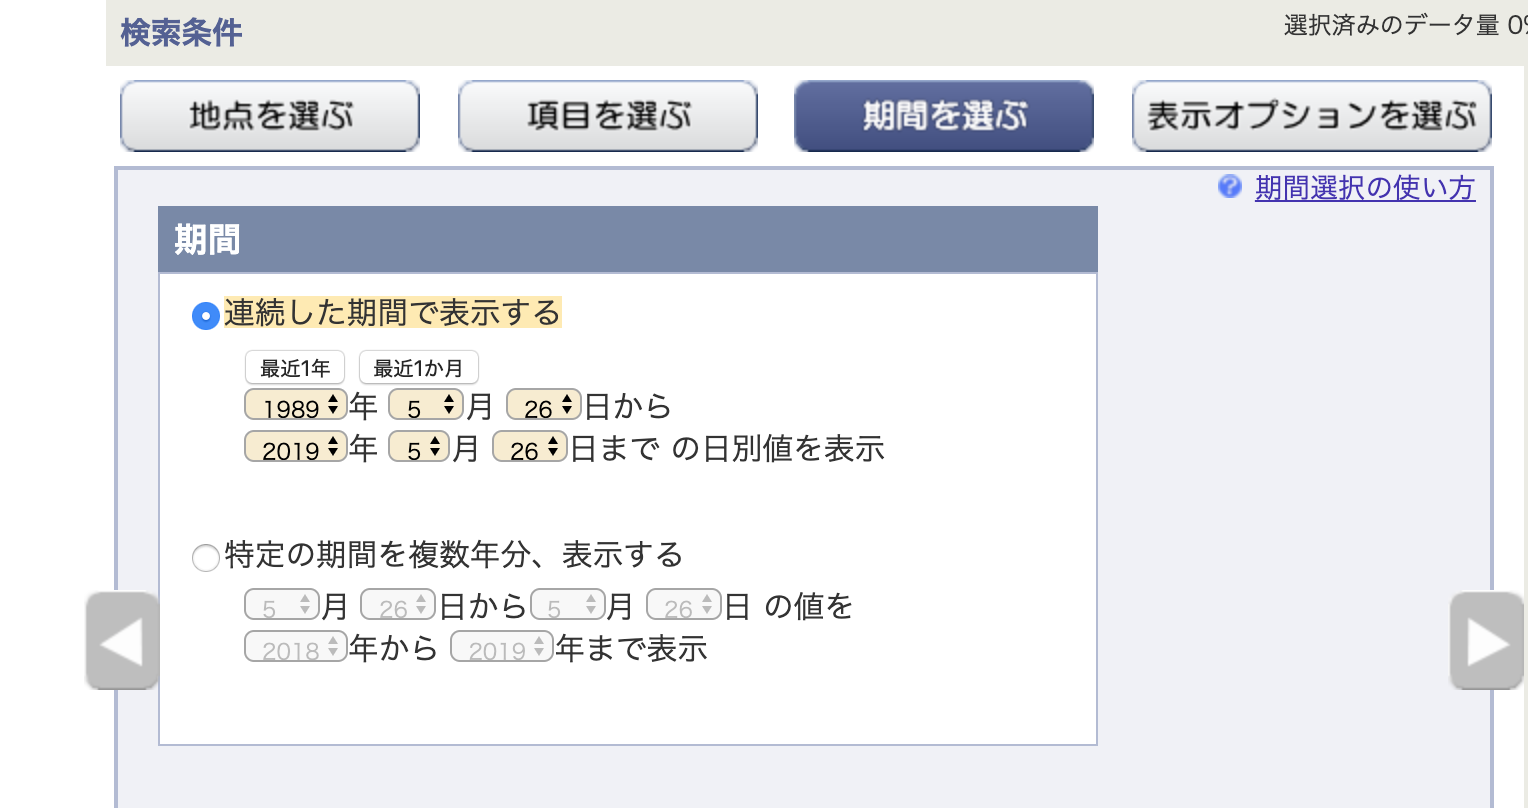
30年分ゲット
IoT Analyticsにデータを送る
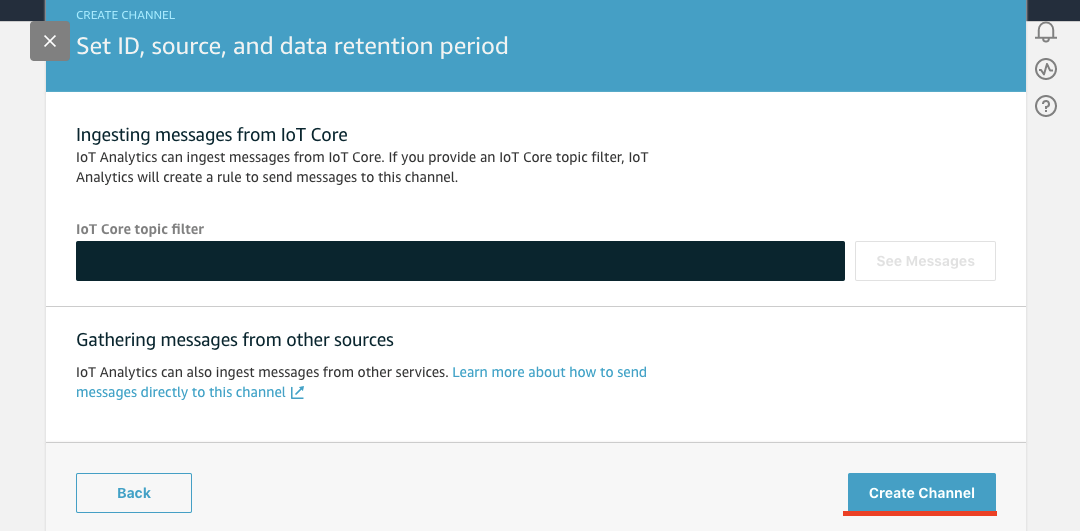
Channel、Pipeline、Data Storeを作る
今回は入力データをそのまま使うので、Pipelineでは特に処理を行わない。

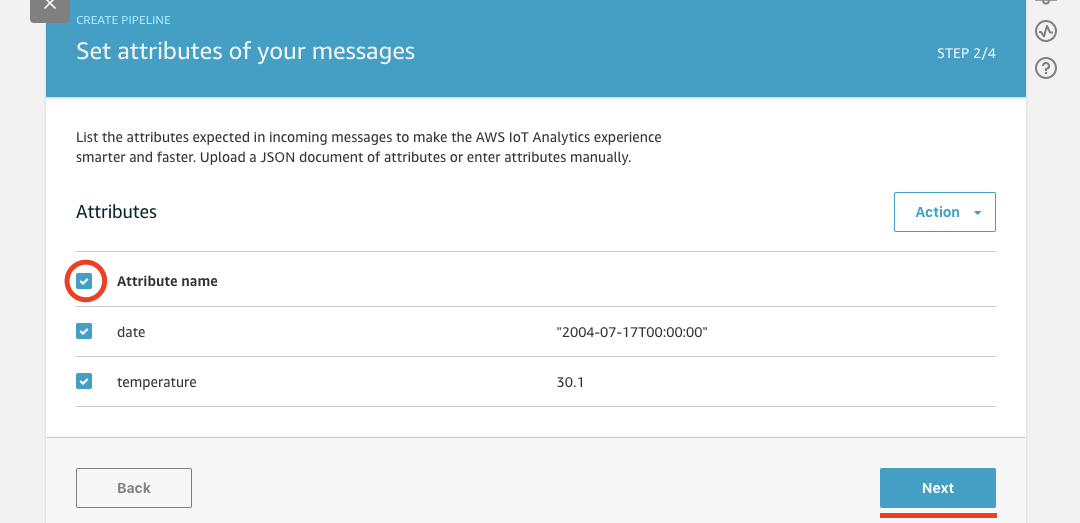
Attribute をセットする。次のアクティビティはそのまま。
tokyo_temperature_store というData store nameにして、Create。
データのPost
手元のPCで以下を実行します。
import csv
import json
import datetime
import boto3

channelName = "tokyo_temperature"
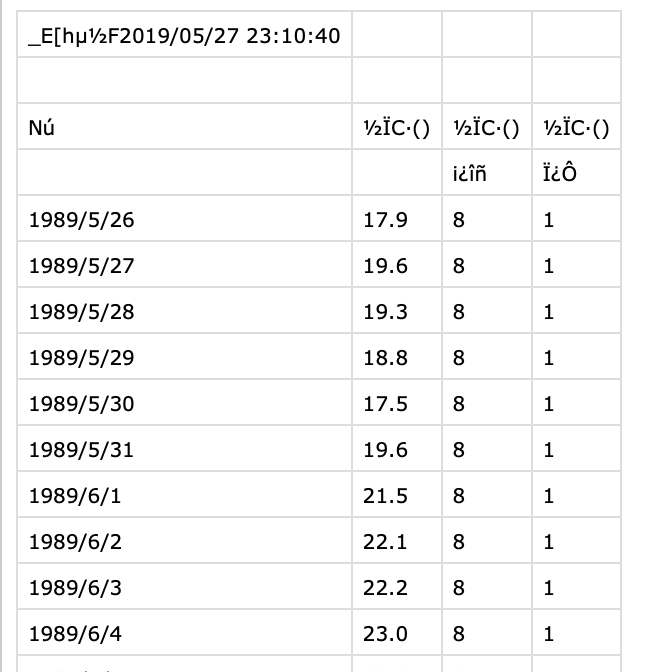
with open('data.csv', encoding='shift_jis') as csvfile:
    reader = csv.reader(csvfile)
    messages = []
    for row in reader:
        if len(row) > 3:
            format_str = '%Y/%m/%d'
            try:
                date = datetime.datetime.strptime(row[0], format_str)
                temperature = row[1]
                blob = {
                        "date": date.isoformat(),
                        "temperature": float(row[1])
                    }
                obj = {
                    "messageId": date.strftime("%Y-%m-%d"),
                    "payload": json.dumps(blob).encode()
                }
                messages.append(obj)
            except:
                continue

    client = boto3.client('iotanalytics', region_name='us-east-1')
    i = 0
    while i < len(messages):
        client.batch_put_message(
            channelName=channelName,
            messages=messages[i:i+99]
        )
        i += 100
payloadのサイズ上限があるため、100個ずつ分割して送っています。
また、region_name は適宜変更が必要です。
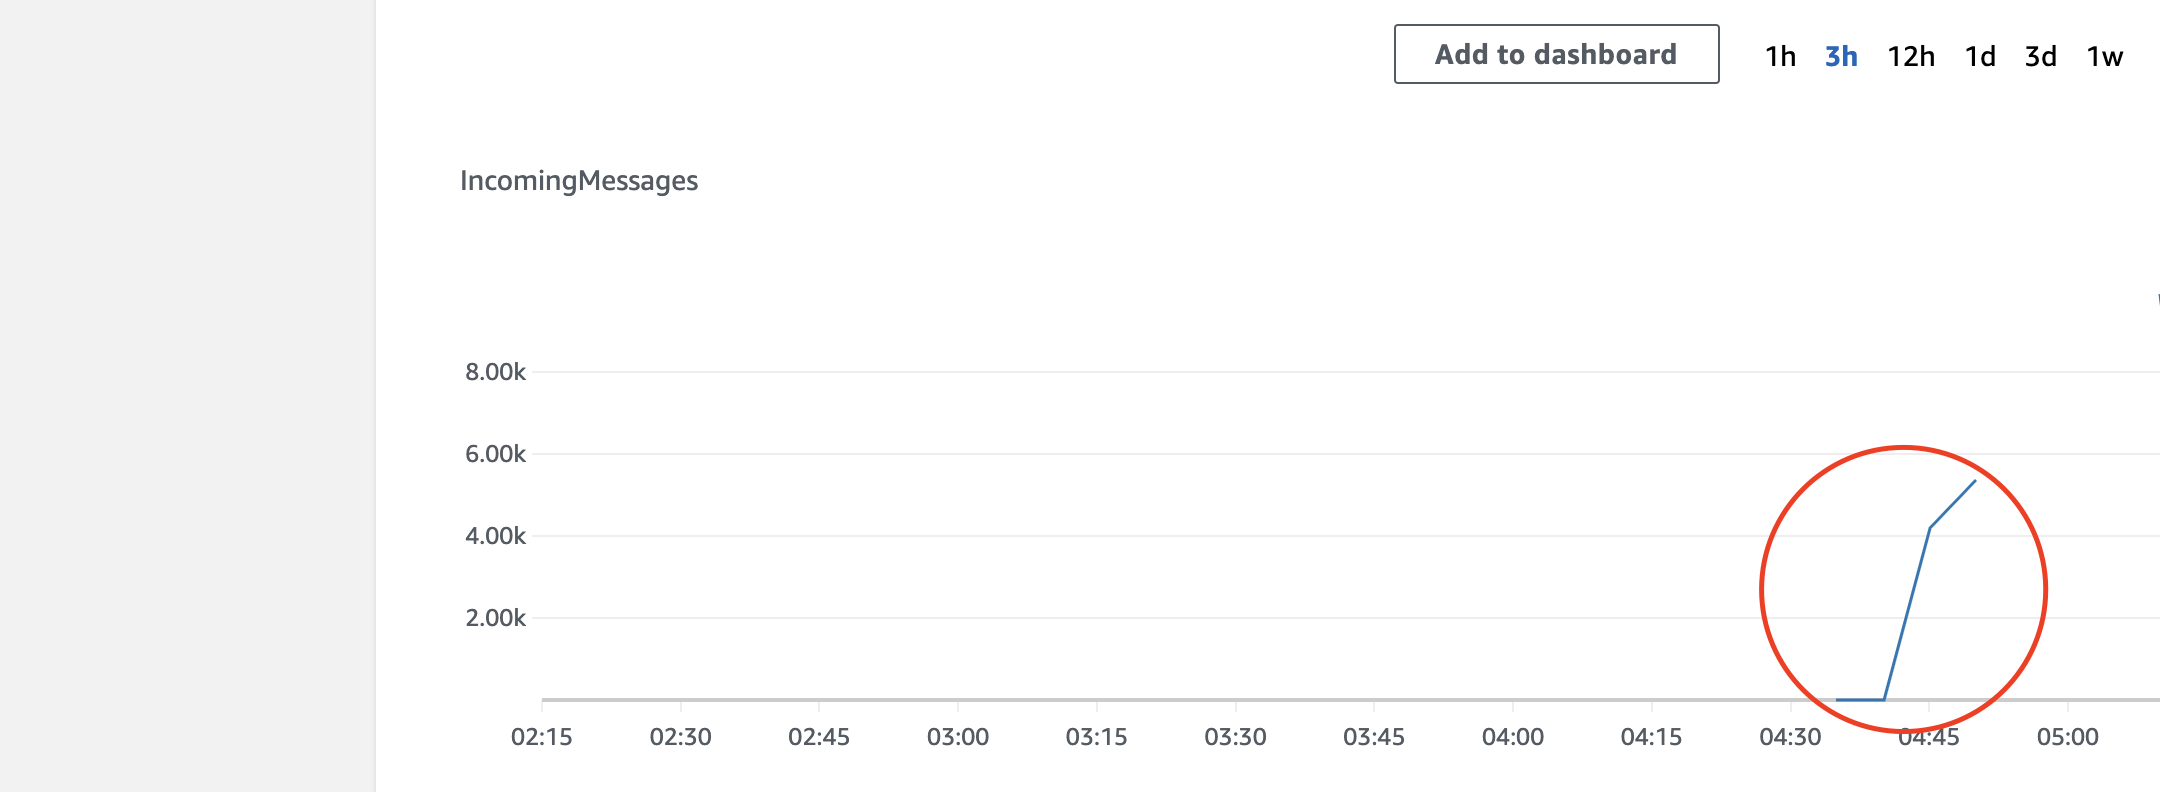
IoT AnalyticsのChannelを見ると、メッセージが受信出来ていることが分かります。
データの可視化
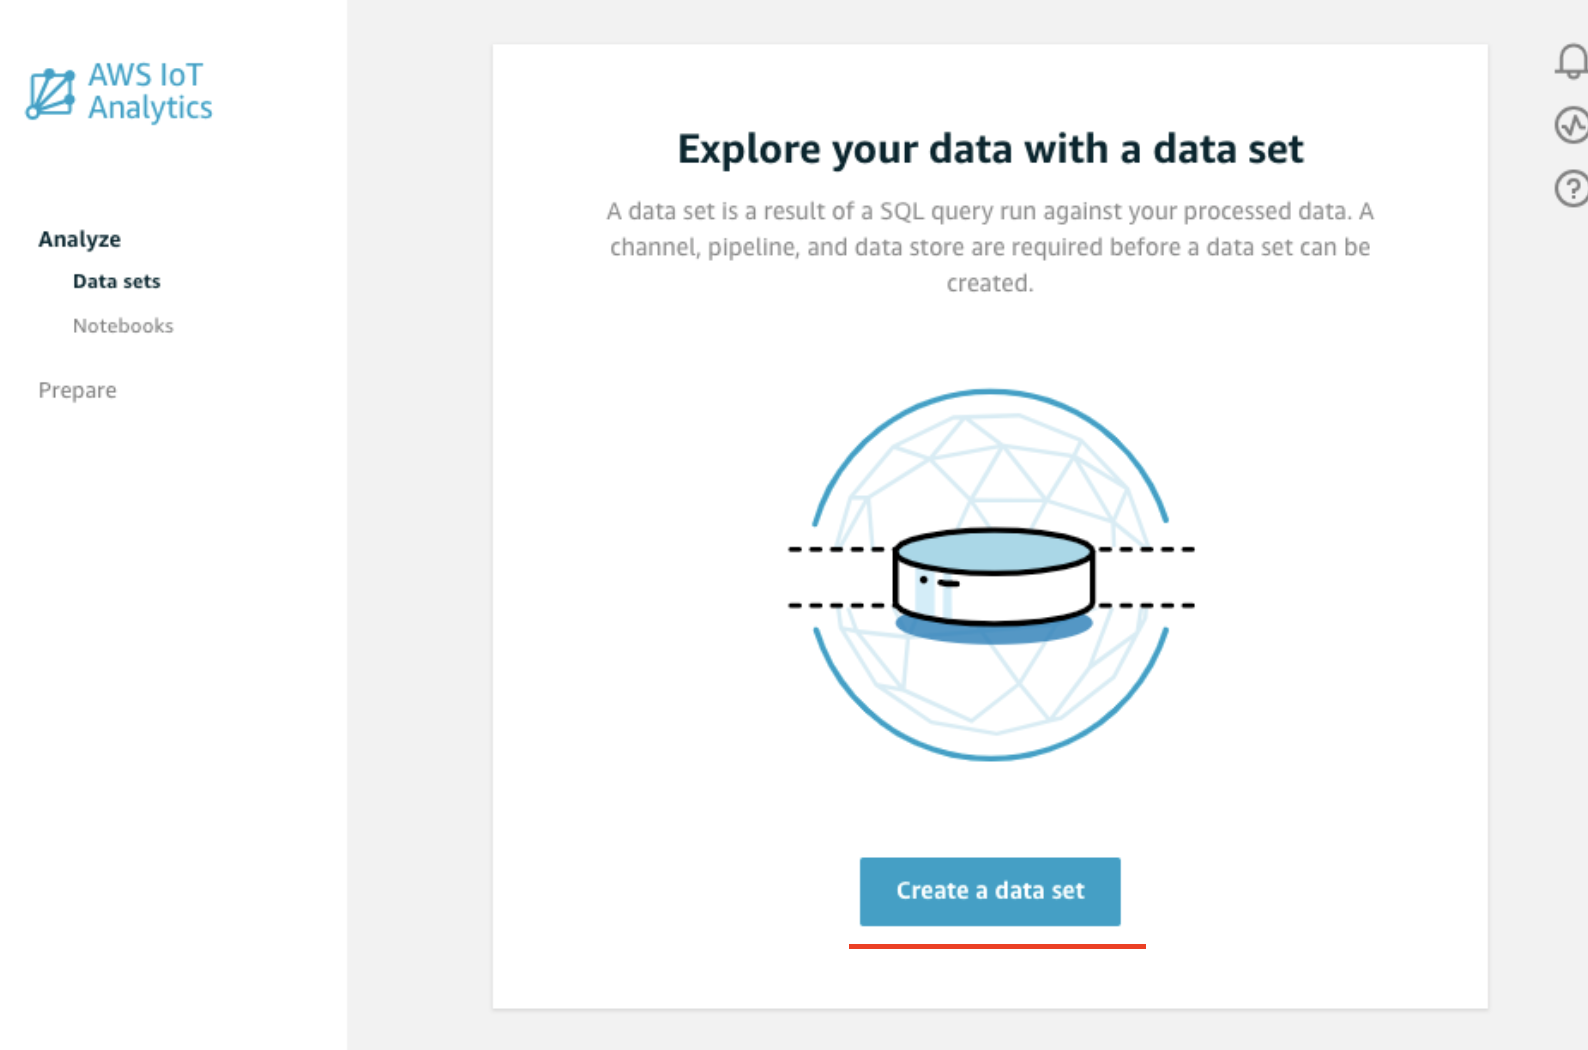
Create a data set を押す。

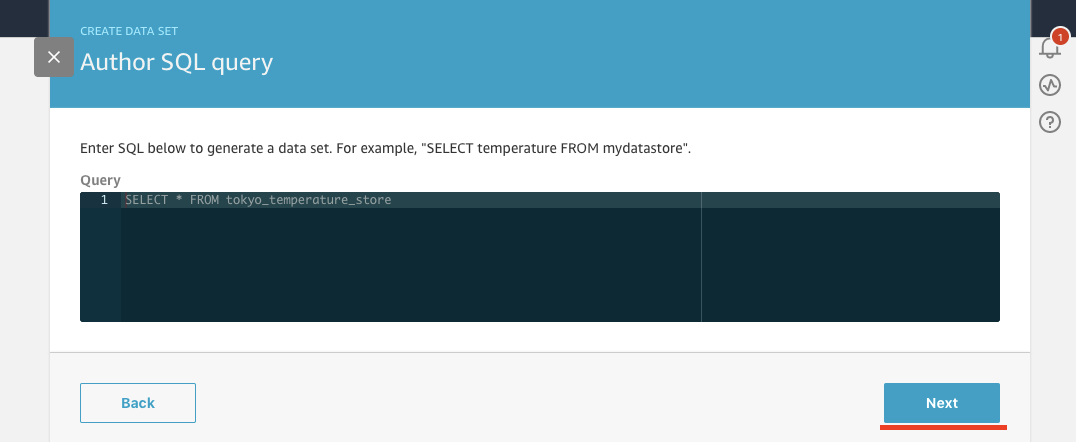
データストアからデータセットを作ります。今回はすべてのデータを使ってデータ・セットを作ります。

IDは、tokyo_temperature_dataset という名前にしました。
source は、先程作ったものを選びます。
すべてを取得するので、クエリはそのまま。残りの項目はすべてデフォルトのままで、Data setを作ります。
出来たデータ・セットを選択し、Action⇨Run nowを押します。
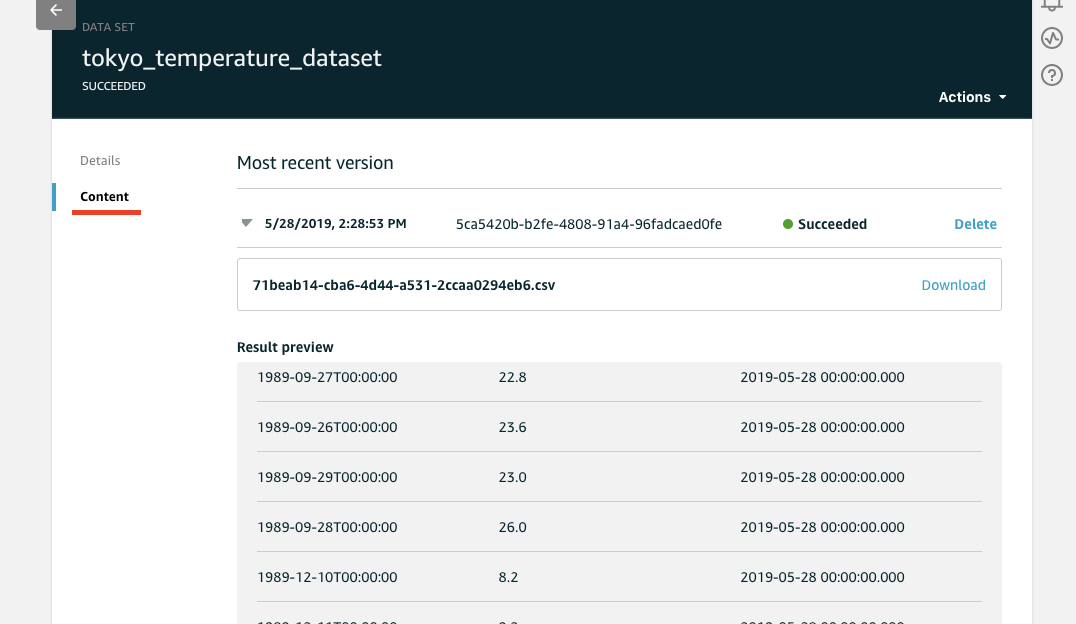
しばらく待ってからContentを押すと、作成されたデータセットがプレビューできます。
データを可視化する
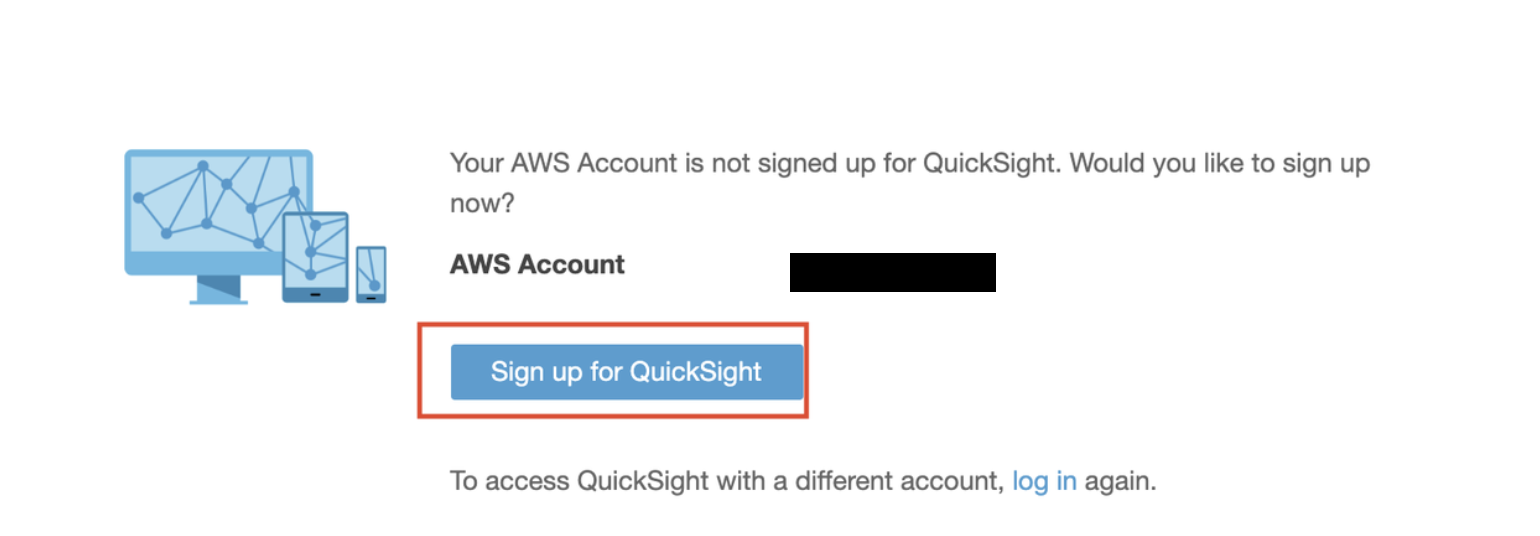
作成したデータ・セットをQuickSightにそのままインポートします。
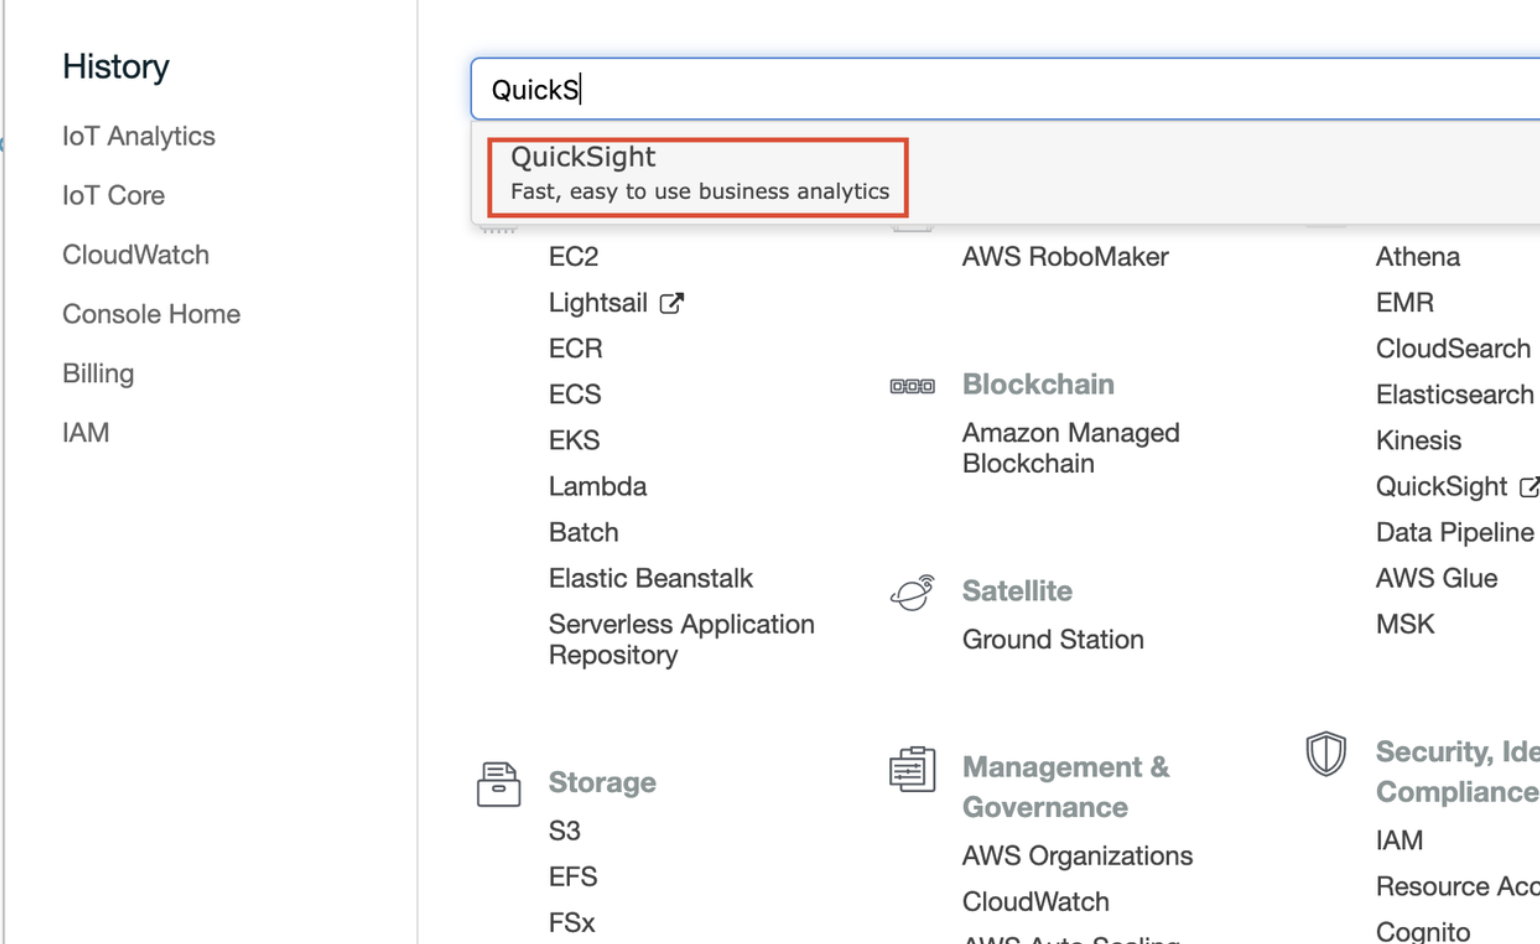
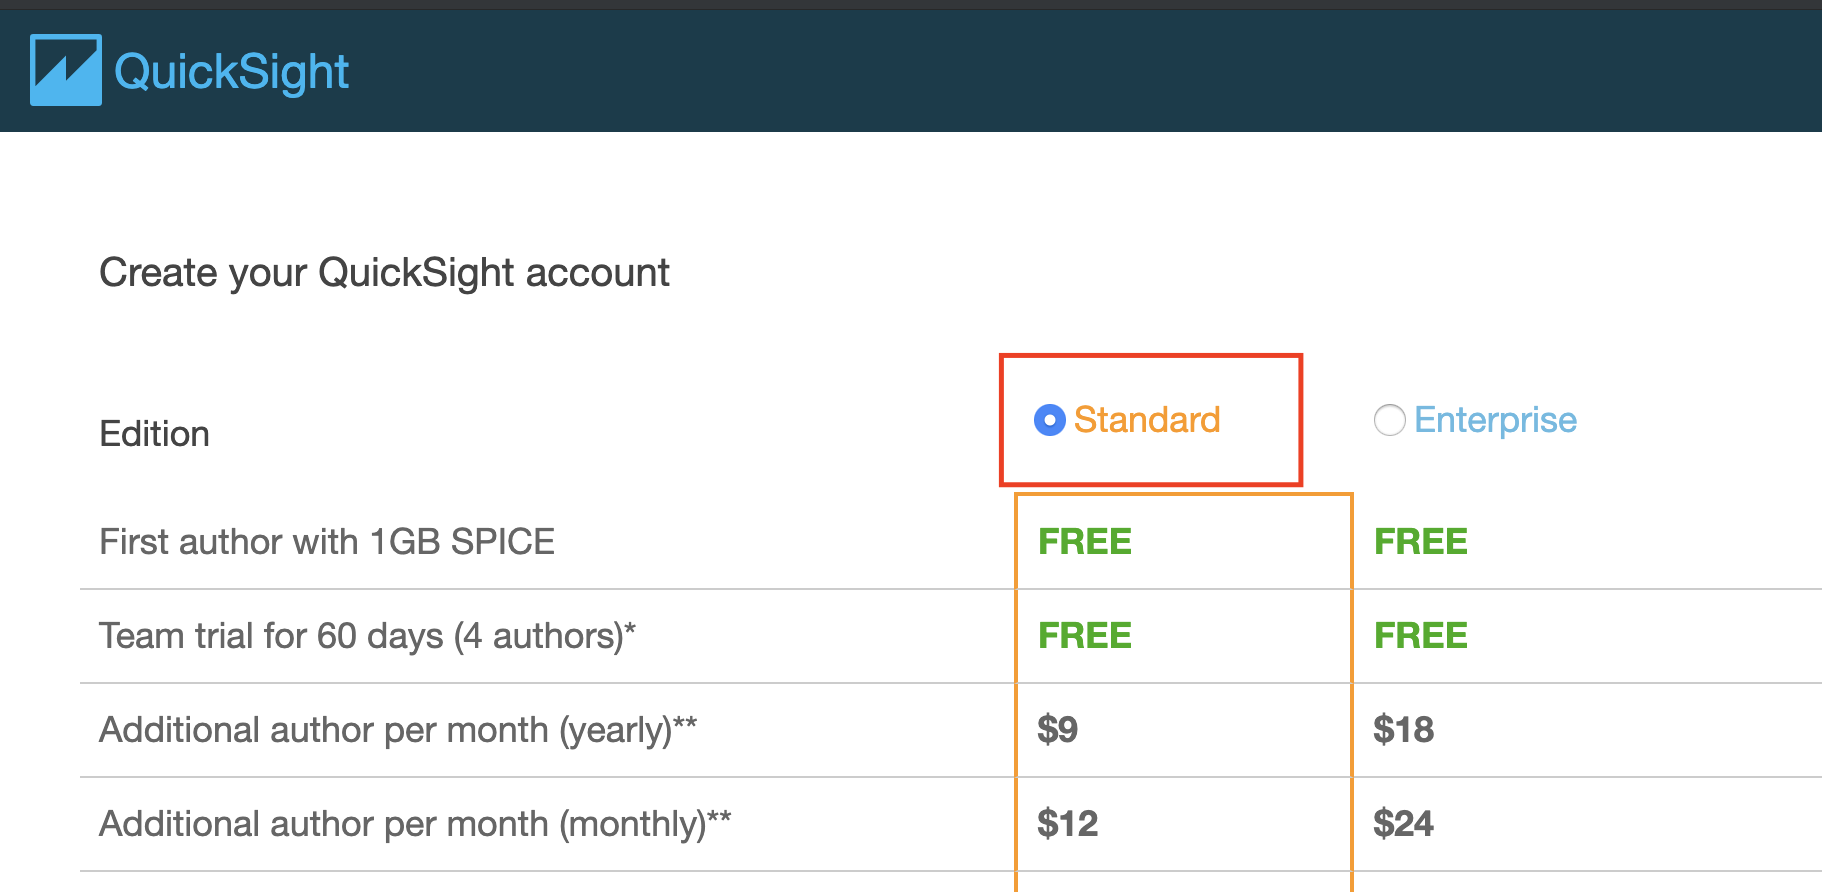
Standardを選択。
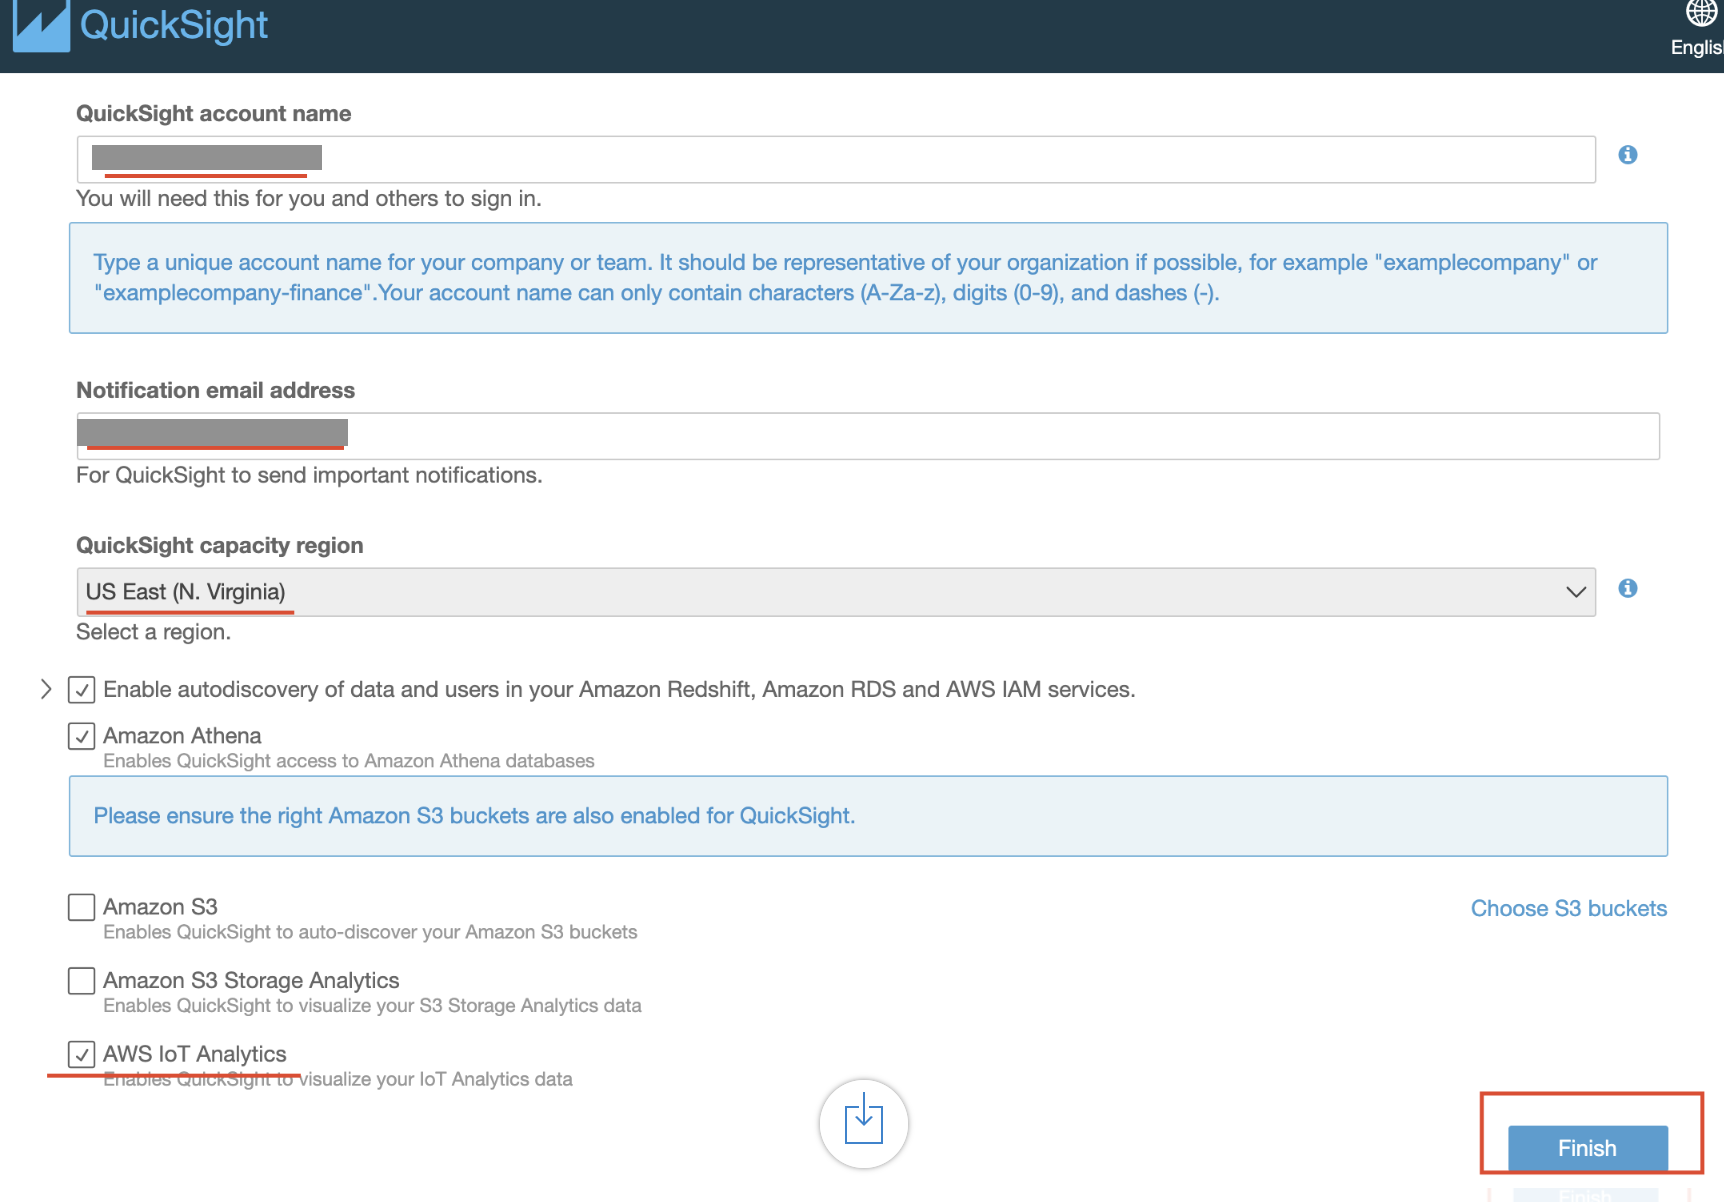
任意のアカウント名、メアドを入力し、AWS IoT AnalyticsにチェックをいれてFinish。
QuickSightにて、New Analysis⇨New data set⇨IoT Analyticsを選択。
作成済みのData source nameを選んで、Visualize.
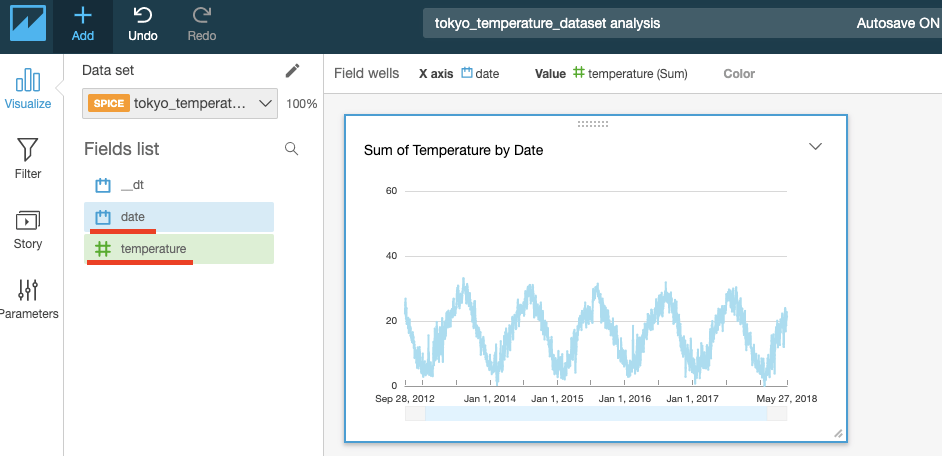
date, temperature を選択するとグラフが表示されました。
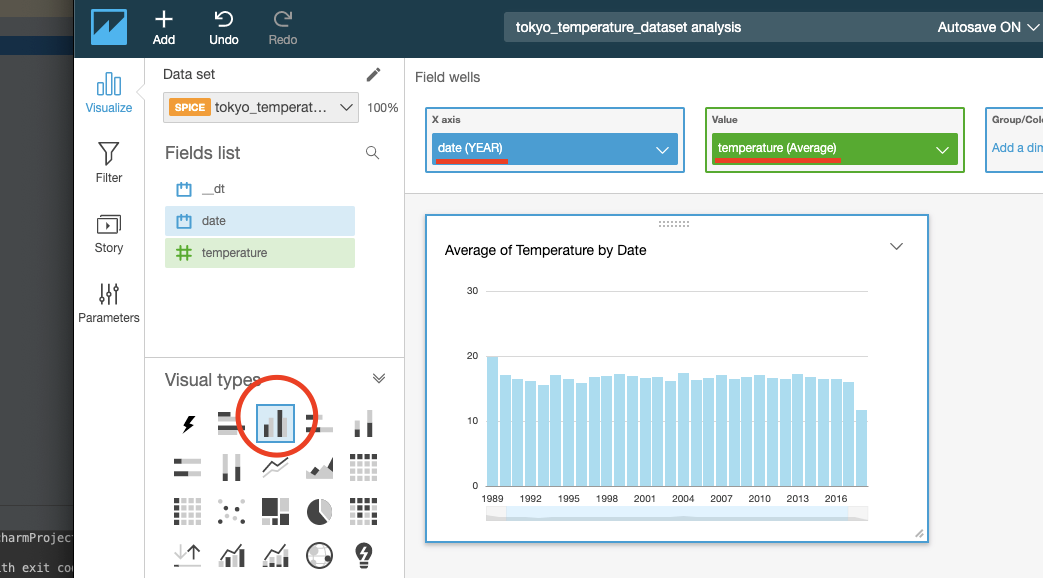
Visual typesから、棒グラフを選んで、X axisに date(YEAR)をセット、ValueにTemperature(Average)をセットし、30年間の年平均を出してみました。大きな気温変化は無いですね。。
