はじめに
前回の記事 1 で銀行の顧客データを単純ベイズ(Naive Bayes)で使えるようにデータを加工、特徴量エンジニアリングの実施をしました。今回はそのデータを利用して実際にモデルの構築を行っていこうと思います。
モデルの構築の目的
前回のおさらいですが、Kaggleのデータの説明にもある通り 2 、このデータセットには顧客が解約したかどうかの列 Exited があります。このデータに単純ベイズによるモデルを用いることで、銀行の顧客が解約するかどうかの予測をしたいと思います。
ライブラリのインポート
今回は GaussianNB を使ってモデルを構築したいので、それに必要なライブラリをインポートします。また、モデルの評価メトリックと、混同行列の生成も行いたいので、それに関するライブラリも読み込みます。
import numpy as np
import pandas as pd
import matplotlib.pyplot as plt
from sklearn.model_selection import train_test_split
from sklearn.naive_bayes import GaussianNB
from sklearn.metrics import recall_score, precision_score, f1_score, accuracy_score
from sklearn.metrics import confusion_matrix, ConfusionMatrixDisplay
データセットの読み込み
前回の記事で作成したデータセットを読み込みます。
churn_df = pd.read_csv("Churn_Modelling2.csv")
pd.set_option('display.expand_frame_repr', False)
pd.set_option('display.max_columns', 23)
print(churn_df.head())
   CreditScore   Balance  NumOfProducts  HasCrCard  IsActiveMember  EstimatedSalary  Exited   Loyalty  Sex  Geography_Germany  Geography_Spain
0        0.538  0.000000       0.000000        1.0             1.0         0.506735     1.0  0.085714  0.0                0.0              0.0
1        0.516  0.334031       0.000000        0.0             1.0         0.562709     0.0  0.043902  0.0                0.0              1.0
2        0.304  0.636357       0.666667        1.0             0.0         0.569654     1.0  0.342857  0.0                0.0              0.0
3        0.698  0.000000       0.333333        0.0             0.0         0.469120     0.0  0.046154  0.0                0.0              0.0
4        1.000  0.500246       0.000000        1.0             1.0         0.395400     0.0  0.083721  0.0                0.0              1.0
データセットの読み込み
データをターゲット変数と予測子に分割します。その上でtrain_test_split() 関数を用いてトレーニングデータとテストデータに分割します。ここではデータの25%をテストデータ、残りの75%をトレーニングデータにします。後で別で確認しておきますが、解約していない/解約したのデータ比率が80:20であることから、 stratify=y を用いて、テストデータ、トレーニングデータの分割を行った際にどちらかに偏って分割されないようにします。
# ターゲット変数を定義
y = churn_df['Exited']

# ターゲット変数を落として、残りを予測子として定義する。
X = churn_df.copy()
X = X.drop('Exited', axis=1)

# トレーニングデータとテストデータに分割
X_train, X_test, y_train, y_test = train_test_split(X, y, test_size=0.25, stratify=y, random_state=1)
print(churn_df['Exited'].value_counts())
0    7963
1    2037
Name: Exited, dtype: int64
モデルの構築
モデルの構築のプロセスは、モデルをトレーニングデータに適合させます。次にモデルを使用してテストデータに対する予測を行います。それではやっていきます。
# モデルをインスタンス化してトレーニングデータを適合させます
gnb = GaussianNB()
gnb.fit(X_train, y_train)

# テストデータから予測値を算出します。
y_preds = gnb.predict(X_test)

# 正解率、精度
print('Accuracy:', '%.3f' % accuracy_score(y_test, y_preds))

# 適合率
print('Precision:', '%.3f' % precision_score(y_test, y_preds, zero_division=0))

# 再現率
print('Recall:', '%.3f' % recall_score(y_test, y_preds, zero_division=0))

# F1スコア
print('F1 Score:', '%.3f' % f1_score(y_test, y_preds, zero_division=0))
Accuracy: 0.805
Precision: 0.540
Recall: 0.281
F1 Score: 0.370
完璧なモデルではないようですが、少なくとも解約した顧客は予測できているようです。
補足
zero_division の引数を省略すると
UndefinedMetricWarning: Precision is ill-defined and being set to 0.0 due to no predicted samples. Use zero_division parameter to control this behavior.
のようなエラーが出力される。詳細はこのあたり 3 を参考にされたい。
混同行列(Confusion Matrix)の生成
続いて、モデルがテストデータをどのように分類したかを混同行列を用いて調べます。
# 混同行列(Confusion Matrix)の生成
cm = confusion_matrix(y_test, y_preds, labels=gnb.classes_)
disp = ConfusionMatrixDisplay(confusion_matrix=cm, display_labels=gnb.classes_,)
disp.plot(values_format='')
plt.show()
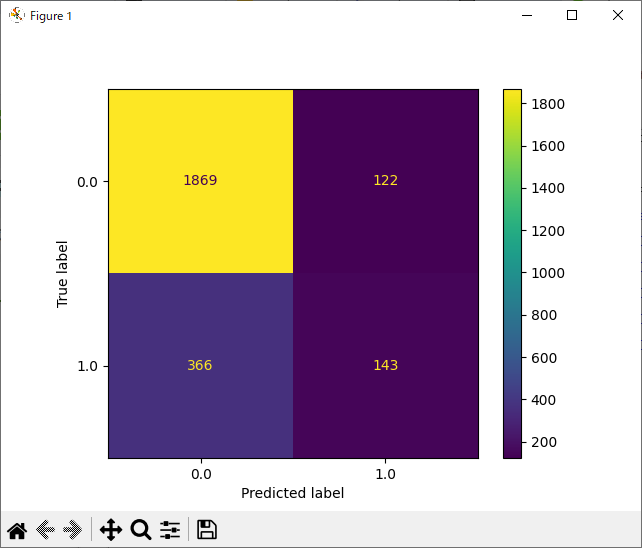
左下の第三象限の偽陰性の数が多く、これが、再現率が 0.281 である理由です。偽陰性は、実際には陽性であるのに、検査で陰性と判定されてしまうことです。言い換えると、解約する(陽性)のに、解約しない(陰性)と予測、判定してしまっています。つまり、モデルが解約する顧客をわずかながらでも見逃してしまっている、ということになります。
以上。
-
データ分析における特徴量エンジニアリングの実践 #Python - Qiita https://qiita.com/tatsu_sekine/items/e0e89b5760a599955fe5 ↩
-
churn_modelling https://www.kaggle.com/datasets/jssunmathi/churn-modelling ↩
-
sklearn.metrics.f1_scoreのUndefinedMetricWarningとzero_division引数 - nikkie-ftnextの日記 https://nikkie-ftnext.hatenablog.com/entry/scikit-learn-f1-score-zero-division-control-undefined-behavior ↩