Reactでのチャート表示にHighcharts Reactが良さそうだったのでRESAS APIを使って試してみました。
47都道府県の人口増減率をチャート表示するものです。
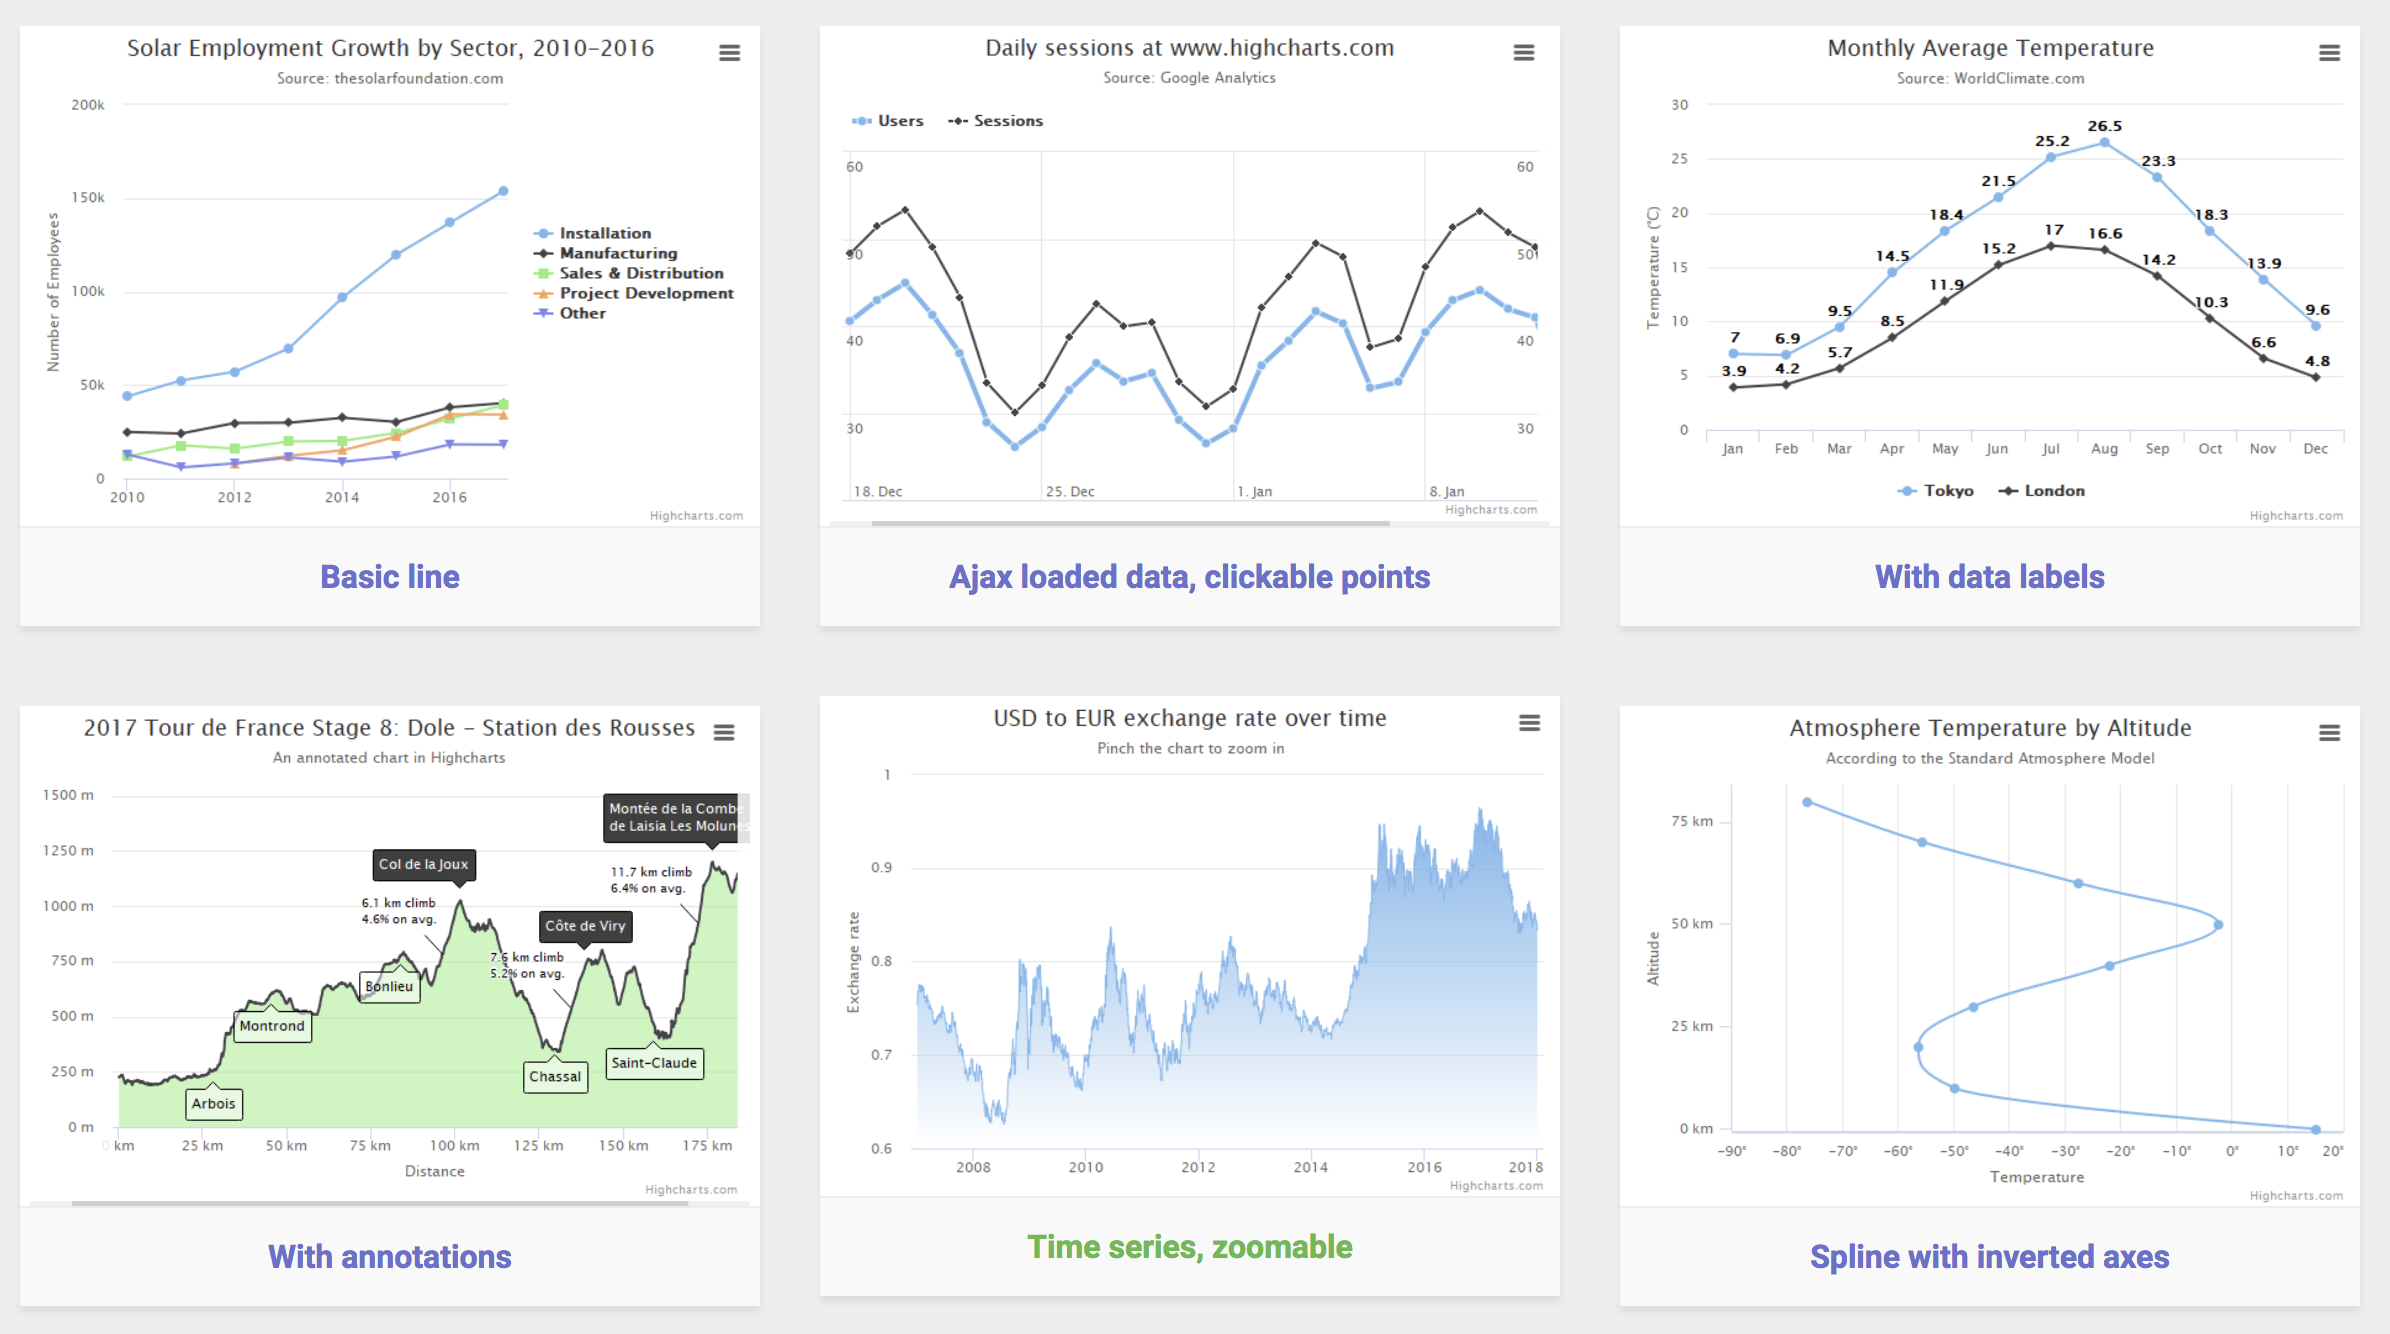
こんな感じ

コードはGitHubに置いてます
https://github.com/tatane616/highcharts-react-resas
Highchartsとは
公式
JavaScriptで簡単にチャート表示ができるライブラリです。
Highcharts ReactはReact用のラッパー
RESAS APIとは
公式
地域経済分析システム(RESAS)は、まち・ひと・しごと創生本部事務局が提供する、産業構造や人口動態、人の流れなどの官民ビッグデータを集約し可視化するシステムで、RESAS APIはそれをAPIとして利用できるようにしたサービスです。
こちらから会員登録をすることでAPI Keyを取得出来ます。
インストール
create-react-appを利用して雛形を作成しました。
Highcharts ReactのinstllationにしたがってRESAS APIの利用に必要なものをインストールします。
npm install -save highcharts-react-official highcharts
実装
App.jsは以下のようになります。
App.js
import React, { Component } from 'react';
import Highcharts from 'highcharts';
import HighchartsReact from 'highcharts-react-official';
import apiKey from './apiKey';

class App extends Component {
  constructor() {
    super();
    this.state = {
      selected: Array(47).fill(false),
      prefectures: {},
      series: []
    };
    this._changeSelection = this._changeSelection.bind(this);
  }

  componentDidMount() {
    // 47都道府県の一覧を取得
    // API Doc: https://opendata.resas-portal.go.jp/docs/api/v1/prefectures.html
    fetch('https://opendata.resas-portal.go.jp/api/v1/prefectures', {
      headers: { 'X-API-KEY': apiKey }
    })
      .then(response => response.json())
      .then(res => {
        this.setState({ prefectures: res.result });
      });
  }

  _changeSelection(index) {
    const selected_copy = this.state.selected.slice();
    // selectedの真偽値を反転
    selected_copy[index] = !selected_copy[index];

    if (!this.state.selected[index]) {
      // チェックされていなかった場合はデータを取得
      // API Doc: https://opendata.resas-portal.go.jp/docs/api/v1/population/sum/perYear.html
      fetch(
        `https://opendata.resas-portal.go.jp/api/v1/population/sum/perYear?cityCode=-&prefCode=${index +
          1}`,
        {
          headers: { 'X-API-KEY': apiKey }
        }
      )
        .then(response => response.json())
        .then(res => {
          let tmp = [];
          Object.keys(res.result.line.data).forEach(i => {
            tmp.push(res.result.line.data[i].value);
          });
          const res_series = {
            name: this.state.prefectures[index].prefName,
            data: tmp
          };
          this.setState({
            selected: selected_copy,
            series: [...this.state.series, res_series]
          });
        });
    } else {
      const series_copy = this.state.series.slice();
      // チェック済みの場合はseriesから削除
      for (let i = 0; i < series_copy.length; i++) {
        if (series_copy[i].name == this.state.prefectures[index].prefName) {
          series_copy.splice(i, 1);
        }
      }
      this.setState({
        selected: selected_copy,
        series: series_copy
      });
    }
  }

  renderItem(props) {
    return (
      <div
        key={props.prefCode}
        style={{ margin: '5px', display: 'inline-block' }}
      >
        <input
          type="checkbox"
          checked={this.state.selected[props.prefCode - 1]}
          onChange={() => this._changeSelection(props.prefCode - 1)}
        />
        {props.prefName}
      </div>
    );
  }

  render() {
    const obj = this.state.prefectures;
    const options = {
      title: {
        text: '人口増減率'
      },
      plotOptions: {
        series: {
          label: {
            connectorAllowed: false
          },
          pointInterval: 5,
          pointStart: 1965
        }
      },
      series: this.state.series
    };
    return (
      <div>
        <h1>Highcharts React + RESAS API Demo</h1>
        <p>
          <a href="https://github.com/highcharts/highcharts-react">
            Highcharts React
          </a>
        </p>
        <p>
          <a href="https://opendata.resas-portal.go.jp/">RESAS API</a>
        </p>
        {Object.keys(obj).map(i => this.renderItem(obj[i]))}
        <HighchartsReact highcharts={Highcharts} options={options} />
      </div>
    );
  }
}

export default App;
チャートは、HighchartsReactのoptionsで指定しますが、公式のDEMOをみて、自分の作りたいものに近いものを見つけてoptionsを真似するのが早いです。
リファレンスはこちら
RESAS APIは都道府県一覧の取得と、都道府県が選択された際の人口増減率の情報取得に利用しています。
注意する点
- リクエストヘッダーに
X-API-KEYを含めなければならない(403 Forbiddenになります) - 都道府県のレンダリングをする際、オブジェクトのイテレーションを
map()で行う(最初forEachでやった為何も表示されませんでした笑) - 配列の一部を変更して
setState()する際は、slice()で配列をコピーしてからコピーに変更を加え、それをsetState()する - Fetchの
.then()の中でthis.setState()する際はアロー関数にする(無名関数だとthisが束縛されず、Appコンポーネントを参照しないため、.bind(this)したら大丈夫なはず)
おわりに
Highcharts便利ですね
もっと良い書き方あるよ!って人はぜひコメントで教えていただけると嬉しいです