前回は量子回路の図示について紹介しましたが,今回は量子ビット間の実際の結合が分かる,配列の図示について見ていきます.(参考:1)
配列図示
ここでは,実機の情報が載っているqiskit.providers.fake_providerを用いて,実機の量子ビットの配列の情報を取ってくることにします.plot_gate_mapを用いると図示してもらえます.
from qiskit.providers.fake_provider import FakeVigoV2
from qiskit.visualization import plot_gate_map

# "Vigo"の仮想のバックエンド "FakeVigoV2" を使用
backend = FakeVigoV2()

# バックエンドのゲートマップを可視化
plot_gate_map(backend)

このマシンは5量子ビットであることや,0と4の間には結合がない(=これらに対し,単純に2量子ビットゲートをかけられない)ことが分かります.
図示できるものは,127量子ビットあるSherbrookeでしょうか.
from qiskit.providers.fake_provider import FakeSherbrooke
backend = FakeSherbrooke()
plot_gate_map(backend)
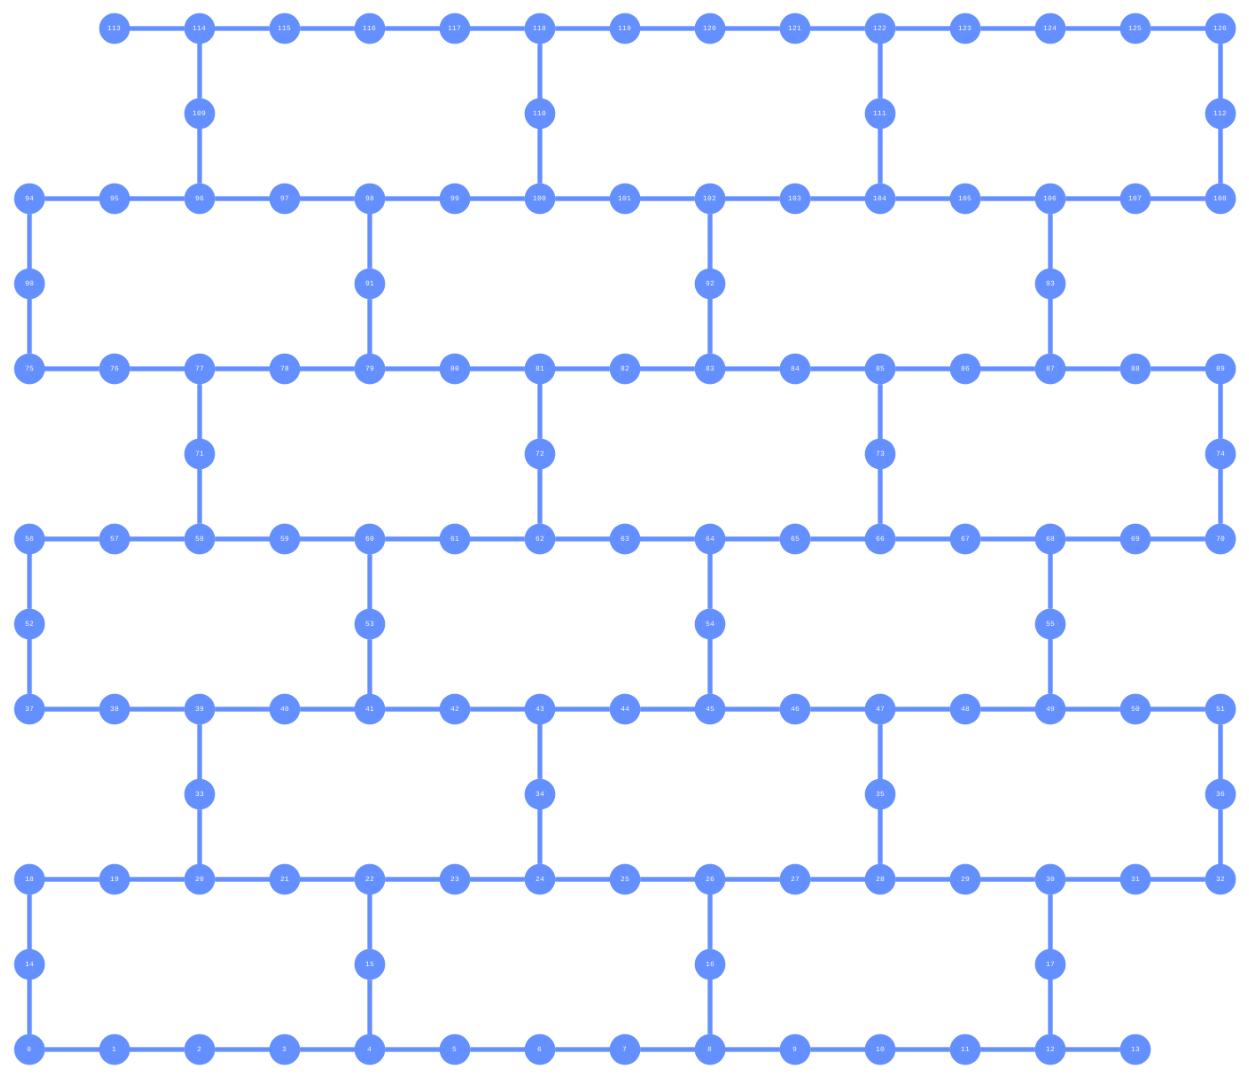
疎ですね.
エラーの情報も図示
実際のマシンは量子ゲートをかける際,測定する際,様々なタイミングでエラーが生じます.その情報も一緒に図示することが可能です.
from qiskit.visualization import plot_error_map

backend = FakeVigoV2()
plot_error_map(backend)
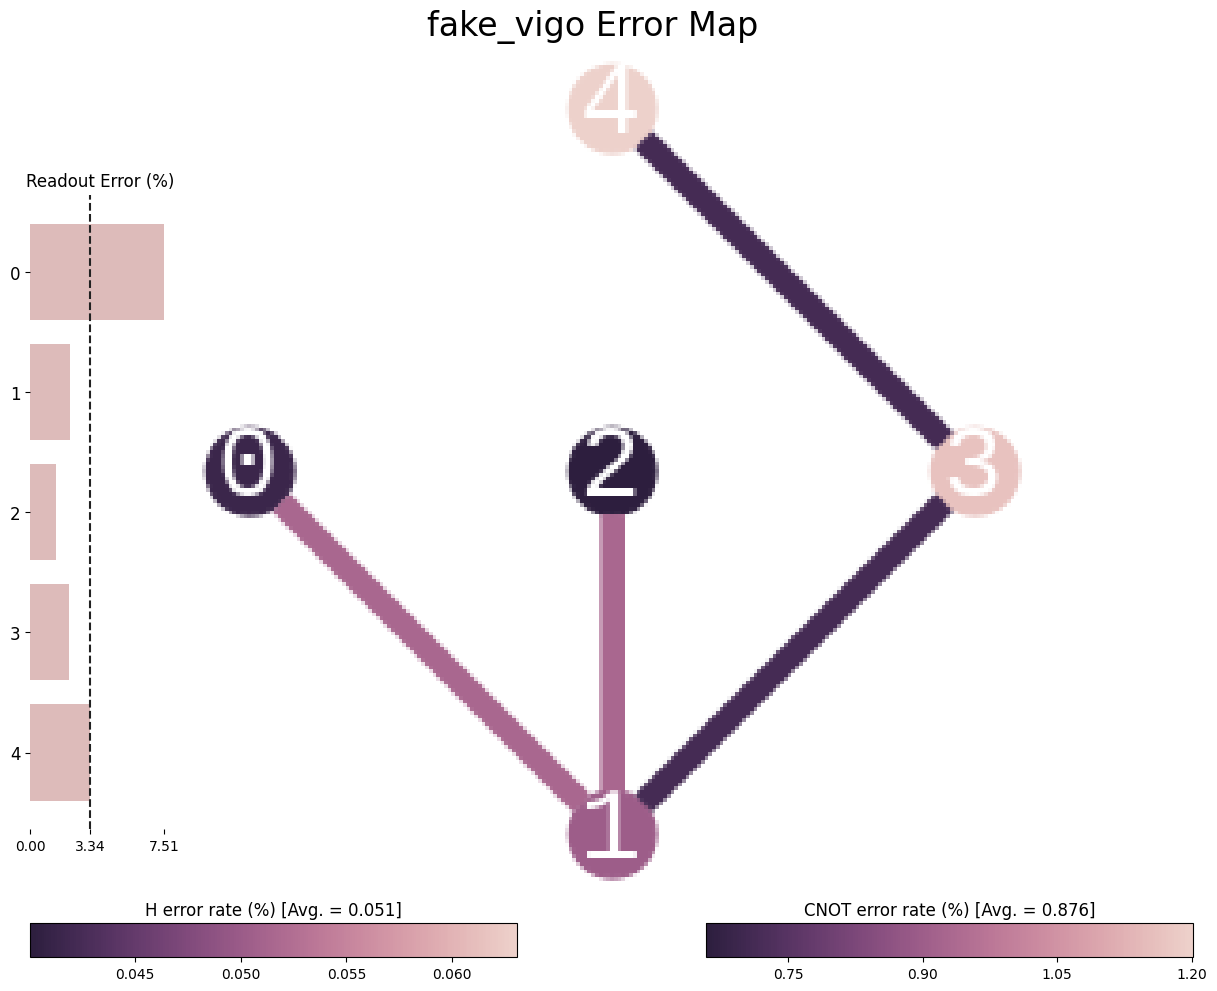
H error rateについては,以下を用いて計算されています.
import numpy as np

num_qubits = backend.num_qubits
single_gate_errors = [0] * num_qubits
for gate, prop_dict in backend.target.items():
    if prop_dict is None or None in prop_dict:
        continue
    for qargs, inst_props in prop_dict.items():
        if inst_props is None:
            continue
        if gate == "measure":
            if inst_props.error is not None:
                read_err[qargs[0]] = inst_props.error
        elif len(qargs) == 1:
            if inst_props.error is not None:
                single_gate_errors[qargs[0]] = max(
                    single_gate_errors[qargs[0]], inst_props.error
                )

# Convert to percent
single_gate_errors = 100 * np.asarray(single_gate_errors)
avg_1q_err = np.mean(single_gate_errors)
例えば,0番目のqubitに対してinst_props.errorを見てみると,
#id InstructionProperties(duration=3.5555555555555554e-08, error=0.0004135213478316029, calibration=None)
#rz InstructionProperties(duration=0.0, error=0, calibration=None)
#sx InstructionProperties(duration=3.5555555555555554e-08, error=0.0004135213478316029, calibration=None)
#x InstructionProperties(duration=3.5555555555555554e-08, error=0.0004135213478316029, calibration=None)
のようになっていることが分かります.これの最大値が色として表現されていることが分かります.
面白いことに,何もしていないidとxゲートなどが同等なエラーレートとなっています.
CNOT error rateも,Readout error rateもありますが,とりあえず次回はこのエラーレートを実験で求められたらと思います.果たして求められるのでしょうか.
終わりに
図示についてはもう少しあるので,時間があるときに追記するかと思います.
Version Information
| Software | Version |
|---|---|
| qiskit | 0.45.0 |
| System information | |
|---|---|
| Python version | 3.10.12 |