Snowflake(Snowpark) + Streamlitでの可視化に興味があったので試しにやってみました。
データはMovieLensのml-latest-small.zipを使用しています。
Snowflakeにデータを入れるまではtroccoを使用しています。
troccoの回し者ではないのですが、とても便利です。無料プランが出てから大変お世話になっています。
troccoの使い方は過去の記事をご参照ください
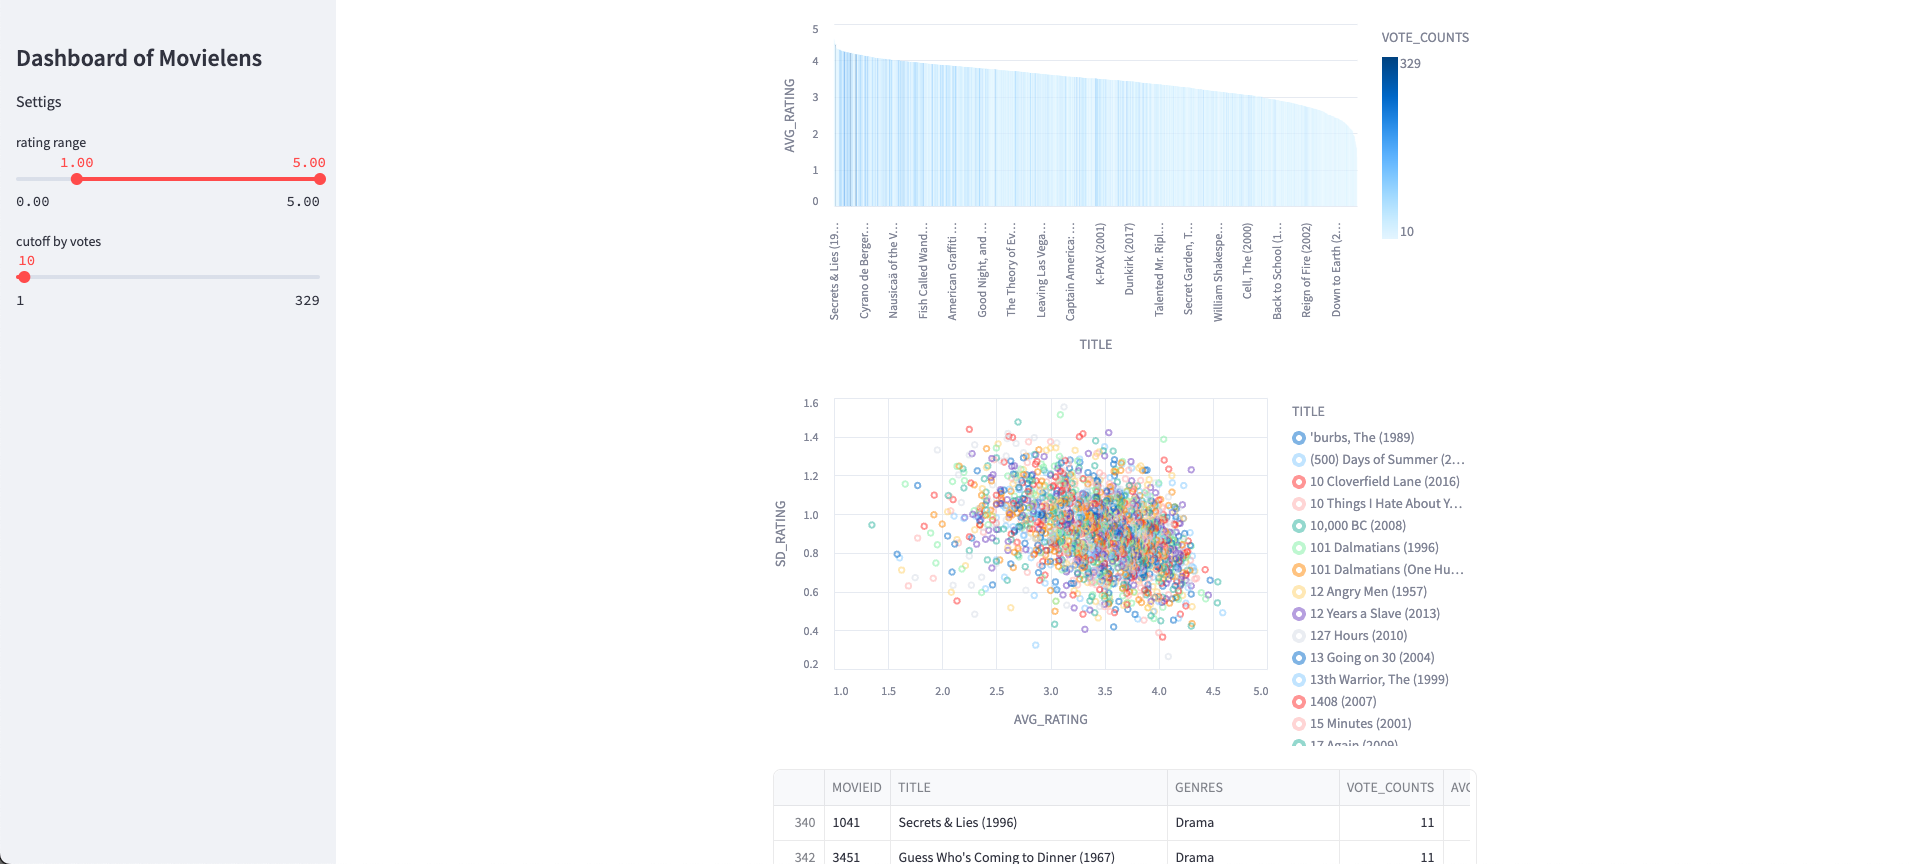
作成したダッシュボード
作成したものは以下のとおりです。
- Vizualization
- 各作品のRatingの平均値を棒グラフで表現したもの
- 各作品のRatingの平均値と標準偏差を散布図で表現したもの
- 上記の可視化に使用しているDataFrame
- 表示する作品の絞り込みFilter
ライブラリのインストール
パッケージ管理にはpipenvを使用しています。
Snowflakeへのアクセスはsnowparkを使用しています。
pipenv install streamlit snowflake-snowpark-python[pandas]
Snowparkを使用してSnowflakeへクエリする
以下のコードでSnowflakeへクエリし、結果をDataFrameで受け取ることができます。
import os

import pandas as pd
from snowflake.snowpark.session import Session


params = {
    "account": os.environ["SF_ACCOUNT"],
    "user": os.environ["SF_USER"],
    "password": os.environ["SF_PASSWORD"],
    "role": os.environ["SF_ROLE"],
    "warehouse": os.environ["SF_WAREHOUSE"],
    "database": os.environ["SF_DATABASE"],
    "schema": os.environ["SF_SCHEMA"],
}

session = Session.builder.configs(params).create()

df = session.sql(
    """
    SELECT
      movieid,
      title,
      genres,
      count(1) AS vote_counts,
      avg(rating) AS avg_rating,
      stddev(rating) AS sd_rating
    FROM
      movies
      JOIN
      ratings
      USING(movieid)
    GROUP BY
      ALL
    ORDER BY
      5 DESC
    """
).to_pandas()
Streamlitの設定
取得したDataFrameの値も使用しながらSidebarの設定を以下の内容で行っています。
Sidebarの設定
import altair as alt
import streamlit as st


st.sidebar.title("Dashboard of Movielens")
st.sidebar.markdown("Settigs")
rate_min, rate_max = st.sidebar.slider(
    "rating range", min_value=0.0, max_value=5.0, value=(1.0, 5.0), step=0.1
)
min_votes = st.sidebar.slider(
    "cutoff by votes", min_value=1, max_value=df.VOTE_COUNTS.max(), value=10
)
可視化するデータの加工
SidebarのSliderで絞り込み条件を変更した際は、その内容を反映させるためにDataFrameを操作しています。
df = df.query(
    "AVG_RATING >= @rate_min and AVG_RATING <= @rate_max and VOTE_COUNTS >= @min_votes"
)
可視化の設定
棒グラフ、散布図、FataFrameそれぞれの設定は以下のとおりです。
グラフの描画にはAltairを使用しています。
bar_plot = (
    alt.Chart(df)
    .mark_bar()
    .encode(x=alt.X("TITLE", sort=None), y="AVG_RATING", color="VOTE_COUNTS")
)
scatter_plot = (
    alt.Chart(df)
    .mark_point(opacity=0.5)
    .encode(
        x=alt.X("AVG_RATING").scale(zero=False),
        y=alt.Y("SD_RATING").scale(zero=False),
        color="TITLE",
    )
)

st.altair_chart(bar_plot, use_container_width=True)
st.altair_chart(scatter_plot, use_container_width=True)
st.dataframe(df.head(10))
コード全体
import os

import altair as alt
import pandas as pd
from snowflake.snowpark.session import Session

import streamlit as st


# create snowflake session
params = {
    "account": os.environ["SF_ACCOUNT"],
    "user": os.environ["SF_USER"],
    "password": os.environ["SF_PASSWORD"],
    "role": os.environ["SF_ROLE"],
    "warehouse": os.environ["SF_WAREHOUSE"],
    "database": os.environ["SF_DATABASE"],
    "schema": os.environ["SF_SCHEMA"],
}

session = Session.builder.configs(params).create()

# fetch data
df = session.sql(
    """
    SELECT
      movieid,
      title,
      genres,
      count(1) AS vote_counts,
      avg(rating) AS avg_rating,
      stddev(rating) AS sd_rating
    FROM
      movies
      JOIN
      ratings
      USING(movieid)
    GROUP BY
      ALL
    ORDER BY
      5 DESC
    """
).to_pandas()

# streamlit sidebar
st.sidebar.title("Dashboard of Movielens")
st.sidebar.markdown("Settigs")
rate_min, rate_max = st.sidebar.slider(
    "rating range", min_value=0.0, max_value=5.0, value=(1.0, 5.0), step=0.1
)
min_votes = st.sidebar.slider(
    "cutoff by votes", min_value=1, max_value=df.VOTE_COUNTS.max(), value=10
)

# transform data
df = df.query(
    "AVG_RATING >= @rate_min and AVG_RATING <= @rate_max and VOTE_COUNTS >= @min_votes"
)

# streamlit chart settings
bar_plot = (
    alt.Chart(df)
    .mark_bar()
    .encode(x=alt.X("TITLE", sort=None), y="AVG_RATING", color="VOTE_COUNTS")
)
scatter_plot = (
    alt.Chart(df)
    .mark_point(opacity=0.5)
    .encode(
        x=alt.X("AVG_RATING").scale(zero=False),
        y=alt.Y("SD_RATING").scale(zero=False),
        color="TITLE",
    )
)

st.altair_chart(bar_plot, use_container_width=True)
st.altair_chart(scatter_plot, use_container_width=True)
st.dataframe(df.head(10))
