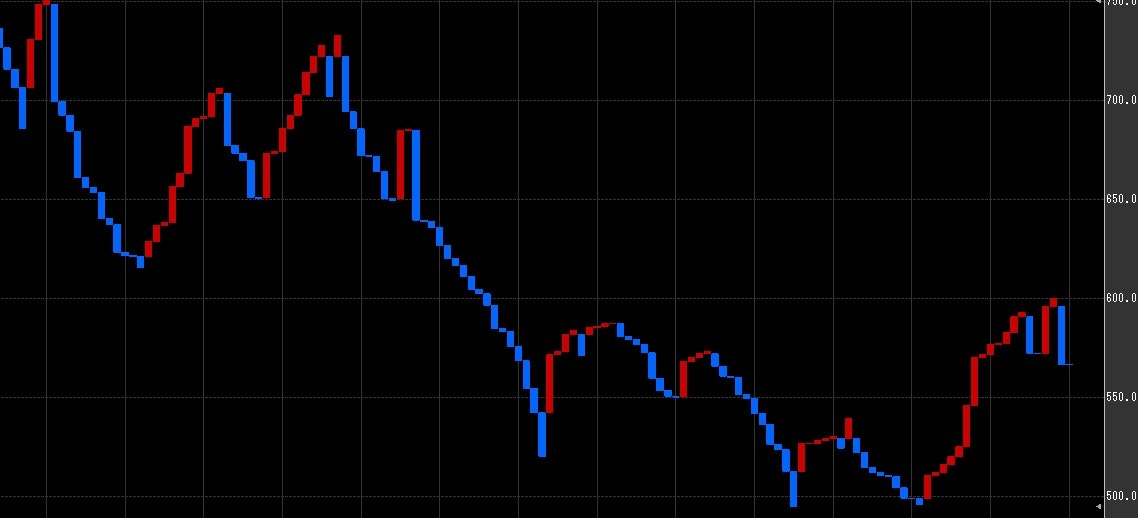
新値3本をAI予測するツールを作って見た。なぜ、新値3本か? Made AI tool to forecast three line break. Why three line break?

注)この投稿はあくまで実験ベースです。計算結果に基づく実際の投資は一切行わないでください。
Caution) This article is for experiment only. Never make any actual investment based on the result.
株価を予測するAIは多く発表されている。しかし、ARIMAモデルなど自己相関に基づくモデル、オシレーター系のテクニカルチャートを使ったモデルなど、いずれも時間軸に縛られたモデルが殆どで、位相の伸縮に対応できないのが難点だ。Lots of AI systems out there to forecast stock price. However, most of them are bound to time axis such as ARIMA model, based on auto-correlation or oscillator based technical chart models, hence they cannot cope with extension or shrinkage of phase.
一方、新値3本は時間軸を無視して値動きのみを捉えたテクニカルチャートだ。過去3回の新値が否定された場合方向が逆転する。上図はTSE東証 8306 MUFG (株)三菱UFJフィナンシャル・グループの新値3本チャートだ。ロウソク足チャートと比べ、かなりすっきり特徴だけが抽出されている。Meanwhile, three line break ignores time axis but focus only on price movement. Denial of last 3 line revert the direction. Picture above shows three line break on TSE 8306 MUFG. Looks much simpler depicting characteristics, compared to original candle stick chart.
このAIでは、2001年から現在までの日次の株価をベースにニューラルネットを教育する。新値3本の過去N本分(初期値は20)の値幅から、つぎの新値の値幅を予測する。厳密は逆転は考慮せず、方向性を見る。学習時間がかなりかかるため、エポックの初期値は3としてあるが、運用時は100位ないと収束しない。This AI train neural net based on daily stock price movement from yr 2001. Forecast next line break from previous N(default is set as 20) three line breaks. Strict reversion is not considered but look for direction. Due to long run time, initial epoch is set as 3 but need to set to 100 for actual use.
すべてJavascript(github here)であなたのマシン上で実行される。WebGLがデフォルトで起動するので、強力なGPUがあるマシンの方が有利だが、なくても十分動作する。All run on your machine by Javascript(github here). WebGL will run on default, hence powerful GPU has advantage however, even if you do not have, it runs pretty ok.