Docker を利用して Jupyter を構築した理由
- 使用している PC の環境を汚したくないため
- 他の人への共有を簡単にするため(若手メンバーに教材として払い出す際の手間を減らしたい)
- Docker の実用的な使い方を確認したい
GitHub リポジトリ
前提条件
- Docker Desktop を既にインストールしていること
- Docker Desktop の状態が
Engine Runningになっていること
開発環境
| 項目 | 内容 | 備考 |
|---|---|---|
| PC | MacBook Air M1 | Python をインストールしていない |
| Webブラウザ | Google Chrome |
題材
過去に Qiita で投稿した下記の内容を Docker にまとめることにした
ディレクトリ・ファイル構成
├── Dockerfile
├── README.md
├── docker-compose.yml
└── workspace
    └── wine
        ├── main.py
        └── winequality-red.csv
手順
1. Docker 関連のファイルを準備
Dockerfile
FROM continuumio/anaconda3
RUN pip install keras tensorflow
WORKDIR /workspace
CMD jupyter-lab --no-browser --port=8888 --ip=0.0.0.0 --allow-root
docker-compose.yml
version: '3'
services:
    wine:
        build: .
        volumes:
            - ./workspace:/workspace
        networks:
            - default
        ports:
            - "8888:8888"
            - "6006:6006"
2. Python ファイルを追加
main.py
import pandas as pd
from sklearn import tree
import matplotlib.pyplot as plt
import pickle

# CSV を読み込み
df = pd.read_csv('winequality-red.csv',sep=";")

# データフレームを出力
print(df)

# 列名を表示
print(list(df.columns.values))

# 説明変数
xcol = ['fixed acidity', 'volatile acidity', 'citric acid', 'residual sugar', 'chlorides', 'free sulfur dioxide', 'total sulfur dioxide', 'density', 'pH', 'sulphates', 'alcohol']
x = df[xcol]

# 目的変数
t = df['quality']

print(t.value_counts)

model = tree.DecisionTreeClassifier(max_depth=3,random_state=0)

# 学習を実行
model.fit(x,t)

# サンプルのデータ
sample = [[0.0, 0.0, 0.0, 0.0, 0.0, 0.0, 0.0, 1.0, 7.0, 0.0, 0.0],[7.9, 0.35, 0.46, 5, 0.078, 15, 37, 0.9973, 3.35, 0.86, 12.8]]
sample = pd.DataFrame(sample,columns = ['fixed acidity','volatile acidity','citric acid','residual sugar','chlorides','free sulfur dioxide','total sulfur dioxide','density','pH','sulphates','alcohol'])

# サンプルデータの予測
print('サンプルデータの予測')
print(model.predict(sample))

# モデルの評価
print(model.score(x,t))

# 決定木の表示
tree.plot_tree(model,feature_names=x.columns,filled=True)

# 散布図の表示
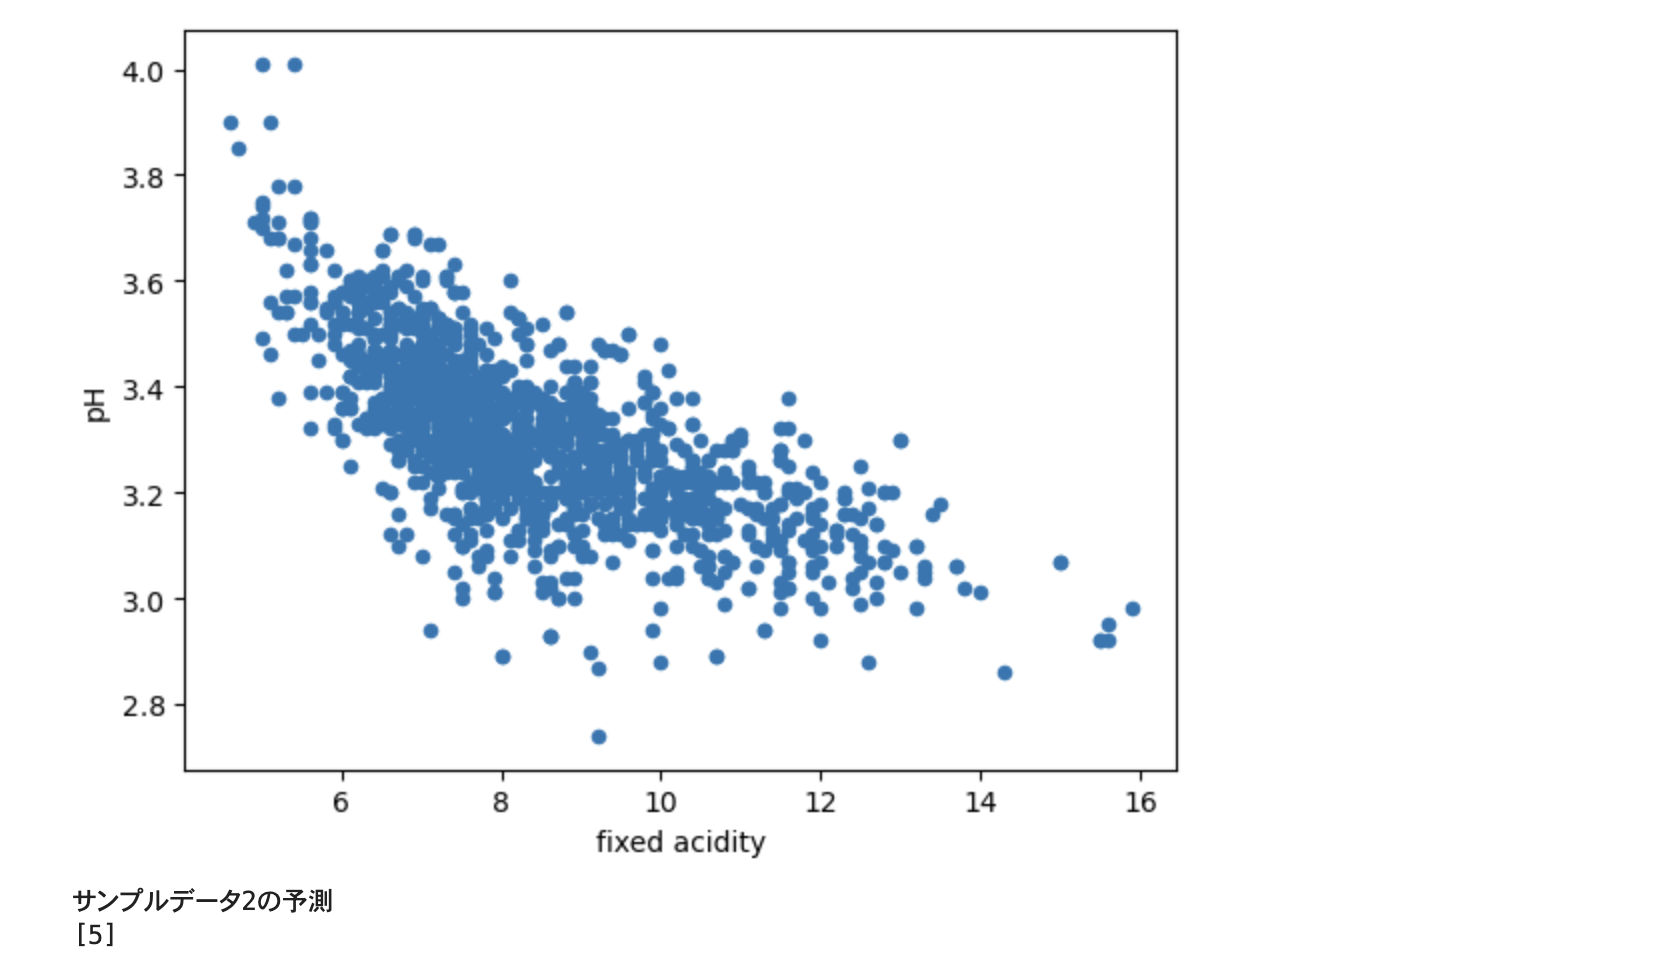
df.plot(kind='scatter', x = 'fixed acidity', y = 'pH')
plt.show()

# モデルの保存
with open('winequality-red.pkl','wb') as f:
    pickle.dump(model, f)


# モデルの読み込み
with open('winequality-red.pkl','rb') as f:
    model2 = pickle.load(f)

# 読み込んだモデルを利用して、予測する
sample2 = [[7.0, 0.1, 0.2, 5, 0.07, 10, 20, 1, 3, 0.8, 10]]
sample2 = pd.DataFrame(sample2,columns = ['fixed acidity','volatile acidity','citric acid','residual sugar','chlorides','free sulfur dioxide','total sulfur dioxide','density','pH','sulphates','alcohol'])
print('サンプルデータ2の予測')
print(model2.predict(sample2))
3. Docker コマンドを利用
Docker コンテナを作成、実行する
cd docker-ml
docker compose up -d
Docker コンテナの実行状況を確認する
docker ps
上記コマンドの実行結果
CONTAINER ID   IMAGE            COMMAND                   CREATED             STATUS             PORTS                                            NAMES
7b5b9230ebf7   docker-ml-wine   "/bin/sh -c 'jupyter…"   About an hour ago   Up About an hour   0.0.0.0:6006->6006/tcp, 0.0.0.0:8888->8888/tcp   docker-ml-wine-1
下記コマンドで Docker コンテナの Python のバージョンを確認できる
docker exec -it 7b5 python --version
上記コマンドの実行結果
Python 3.10.9
4. Web ブラウザで Jupyter を表示
Web ブラウザで下記アドレスにアクセスする
http://localhost:8888/
初回はトークンの入力を求められる
下記コマンドでトークンを確認する
docker compose logs
5. Jupyter で Python を実行
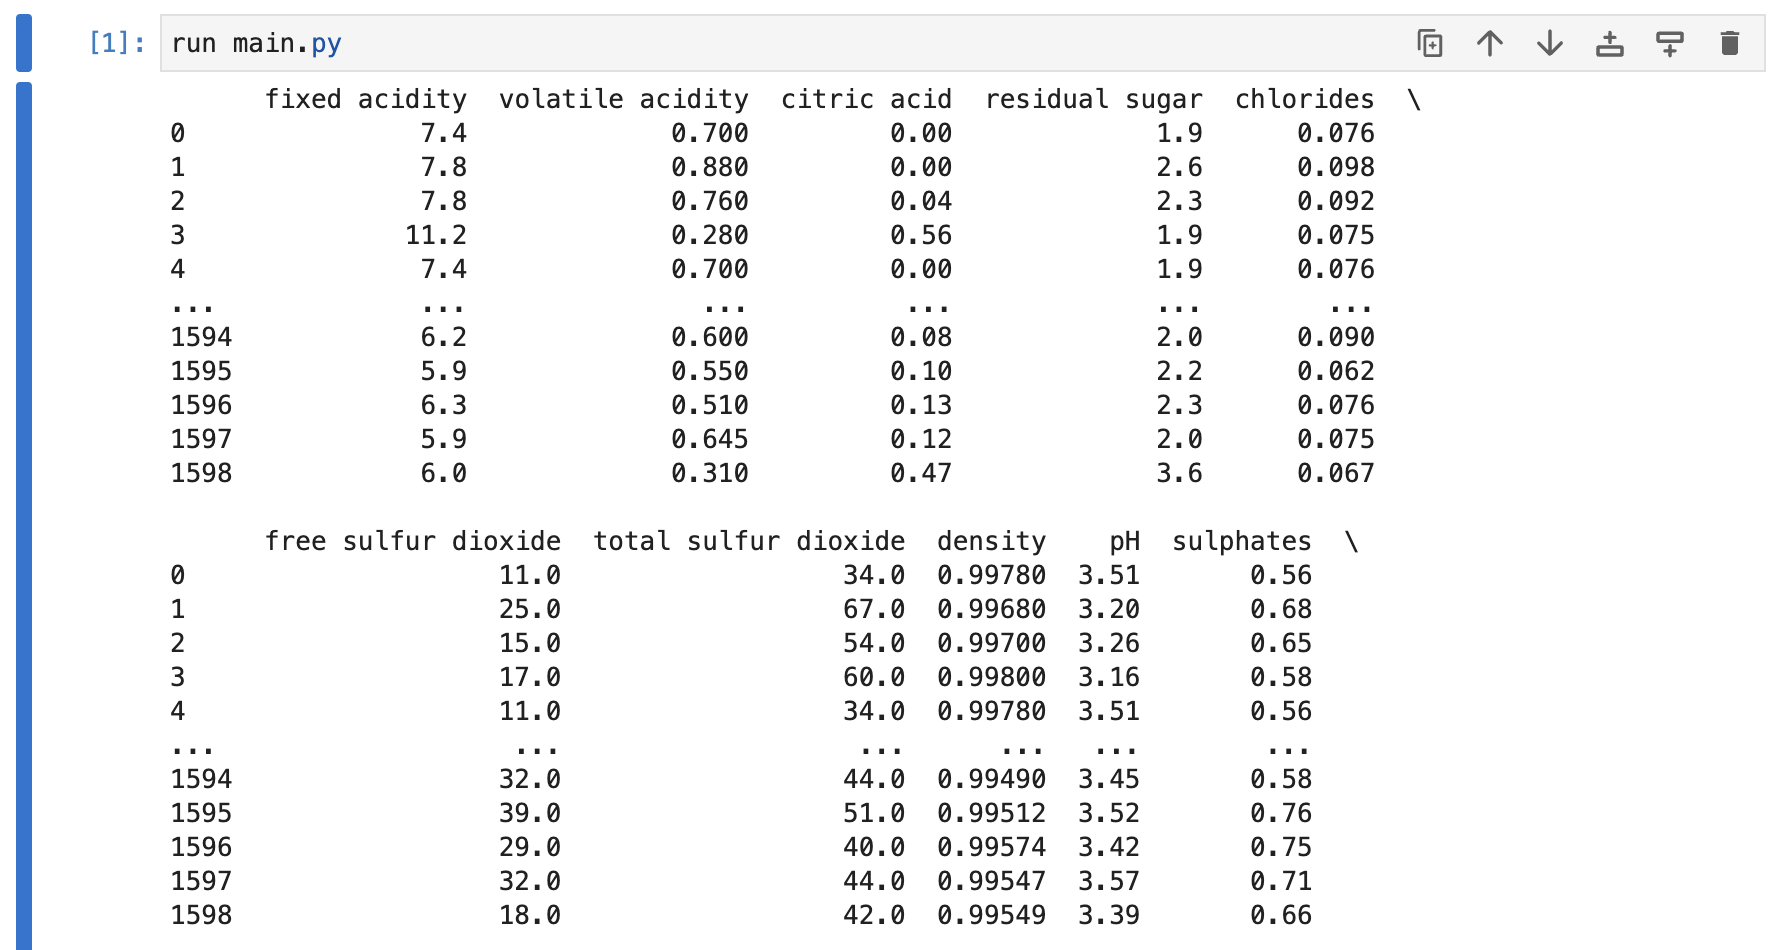
run main.py
6. 実行結果を確認
7. Docker コンテナの停止・削除
Docker コンテナの一覧を表示する
docker ps
上記コマンドの実行結果
CONTAINER ID   IMAGE            COMMAND                   CREATED             STATUS             PORTS                                            NAMES
7b5b9230ebf7   docker-ml-wine   "/bin/sh -c 'jupyter…"   About an hour ago   Up About an hour   0.0.0.0:6006->6006/tcp, 0.0.0.0:8888->8888/tcp   docker-ml-wine-1
Docker コンテナを停止する
docker stop 7b5
Docker コンテナを削除する
docker rm 7b5
8. Docker イメージの削除
Docker イメージの一覧を表示する
docker images
上記コマンド実行結果
REPOSITORY           TAG       IMAGE ID       CREATED        SIZE
docker-ml-wine       latest    3c9361d00629   15 hours ago   4.28GB
Docker イメージを削除する
docker rmi 3c9
参考にした GitHub リポジトリ

