pythonでGANの勉強をしていきたいと思います。
自分の勉強のメモとなります。
コードが見づらかったり、正しくない場合があるかもしれません。
まずは、オートエンコーダについて勉強していきます。
「はじめてのディープラーニング」をもとにkerasやpytorchでも実装してみるという流れとなります。
オートエンコーダ
オートエンコーダはエンコーダとデコーダの2つの部分からなります。
- エンコーダ
訓練済みのエンコーダを使って、最初のデータ表現、例えば画像$x$を入力とすれば、その次元を$\tilde{y}$ を$\tilde{z}$ に減らす - 潜在空間($z$)
ネットワークを訓練するにあたって、潜在空間に何らかの意味が形成される
通常は入力より小さな次元で、中間ステップとして動作 - デコーダ
元の表現と同じものを、元の次元で再構築する
このステップにより$z$は$x^*$に変換される
オートエンコーダの訓練は以下のように行われる。
- 画像$x$を取り出しオートエンコーダに入力する
- $x^*$ が出力される。これは再構成された画像である。
- 再構成誤差を計算する。これは$x$と$x^*$の差である。
これは$x$と$x^*$ の距離(例えばMAE)として計算され、明示的な目的関数($|x-x^*|$)が定義され、勾配降下法により最適化可能となる
実装
まずはnumpyだけでの実装です。
一番下にのせた参考書をもとに作成します。
まず、各層の実装です。
中間層と出力層のみとなります。
import numpy as np

class BaseLayer:
    def update(self, eta):
        self.w -= eta * self.grad_w
        self.b -= eta * self.grad_b

class MiddleLayer(BaseLayer):
    def __init__(self, n_upper, n):
        self.w = np.random.randn(n_upper, n) * np.sqrt(2/n_upper)
        self.b = np.zeros(n)

    def forward(self, x):
        self.x = x
        self.u = np.dot(x, self.w) + self.b
        self.y = np.where(self.u <= 0, 0, self.u) # ReLU

    def backward(self,grad_y):
        delta = grad_y * np.where(self.u <=0 , 0, 1)

        self.grad_w = np.dot(self.x.T, delta)
        self.grad_b = np.sum(delta, axis=0)
        self.grad_x = np.dot(delta, self.w.T)

class OutputLayer(BaseLayer):
    def __init__(self, n_upper, n):
        self.w = np.random.randn(n_upper, n) * np.sqrt(2/n_upper)
        self.b = np.zeros(n)

    def forward(self, x):
        self.x = x
        u = np.dot(x, self.w) + self.b
        self.y = 1/(1+np.exp(-u))

    def backward(self, t):
        delta = (self.y-t) * self.y * (1-self.y)

        self.grad_w = np.dot(self.x.T, delta)
        self.grad_b = np.sum(delta, axis=0)
        self.grad_x = np.dot(delta, self.w.T)
次に、順伝搬と逆伝播、パラメータ更新の定義をします。
def forward_propagation(x_mb):
    middle_layer.forward(x_mb)
    output_layer.forward(middle_layer.y)

def backpropagation(t_mb):
    output_layer.backward(t_mb)
    middle_layer.backward(output_layer.grad_x)

def update_params():
    output_layer.update(eta)
    middle_layer.update(eta)
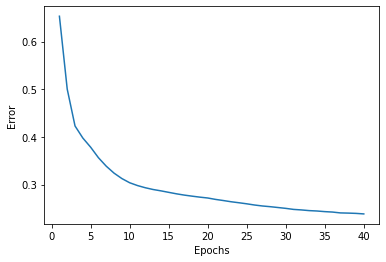
学習を行います。
import matplotlib.pyplot as plt
from sklearn import datasets

digits_data = datasets.load_digits()
x_train = np.asarray(digits_data.data)
x_train /= 15

def get_error(y, t):
    return 1.0/2.0*np.sum(np.square(y - t))

img_size = 8
n_in_out = img_size * img_size
n_mid = 16

eta = 0.01
epochs = 41
batch_size = 32
interval = 4

middle_layer = MiddleLayer(n_in_out, n_mid)
output_layer = OutputLayer(n_mid, n_in_out)

error_record = []
n_batch = len(x_train) // batch_size
for i in range(epochs):

    index_random = np.arange(len(x_train))
    np.random.shuffle(index_random)
    for j in range(n_batch):
        mb_index = index_random[j*batch_size : (j+1)*batch_size]
        x_mb = x_train[mb_index, :]

        forward_propagation(x_mb)
        backpropagation(x_mb)

        update_params()

    forward_propagation(x_train)
    error = get_error(output_layer.y, x_train)
    error_record.append(error)

    if i%interval == 0:
        print("Epoch:"+str(i+1)+'/'+str(epochs), "Error:"+str(error))

plt.plot(range(1, len(error_record)+1), error_record)
plt.xlabel("Epochs")
plt.ylabel("Error")
plt.show()
結果の確認をします。
上の行は入力画像、真ん中の行は潜在空間、一番下の行が出力結果です。
n_img = 10
middle_layer.forward(x_train[:n_img])
output_layer.forward(middle_layer.y)

plt.figure(figsize=(10, 3))
for i in range(n_img):

    ax = plt.subplot(3, n_img, i+1)
    plt.imshow(x_train[i].reshape(img_size, -1).tolist(), cmap="Greys_r")

    ax.get_xaxis().set_visible(False)
    ax.get_yaxis().set_visible(False)

    ax = plt.subplot(3, n_img, i+1+n_img)
    plt.imshow(middle_layer.y[i].reshape(4, -1).tolist(), cmap="Greys_r")
    ax.get_xaxis().set_visible(False)
    ax.get_yaxis().set_visible(False)

    ax = plt.subplot(3, n_img, i+1+2*n_img)
    plt.imshow(output_layer.y[i].reshape(img_size, -1).tolist(), cmap="Greys_r")
    ax.get_xaxis().set_visible(False)
    ax.get_yaxis().set_visible(False)
入力画像が再現され散ることがわかります。
pytorch
同じことをpytorchで実装してみたいと思います。
まず必要なライブラリのインポートをします。
import torch
import torch.nn as nn
import torch.optim as optimizers
from torch.utils.data import Dataset, DataLoader, TensorDataset
データの準備ですが、さきほどと同じデータを使用します。
digits_data = datasets.load_digits()
x_train = np.asarray(digits_data.data)
x_train /= 15
x_train = x_train.reshape(-1, 1, 64)
y = digits_data.target

x_train = torch.tensor(x_train, dtype=torch.float32)
y_train = torch.tensor(y, dtype=torch.float64)

train = TensorDataset(x_train, y_train)
train_dataloader = DataLoader(train, batch_size=32, shuffle=True)
オートエンコーダを定義します。
class AutoEncoder(nn.Module):
    def __init__(self, device='cpu'):
        super().__init__()
        self.device = device
        self.l1 = nn.Linear(64, 16)
        self.l2 = nn.Linear(16, 64)

    def forward(self, x):
        h = self.l1(x)
        h = torch.relu(h)
        h = self.l2(h)
        y = torch.sigmoid(h)

        return y
モデルの設定を行います。
device = None

model = AutoEncoder(device=device).to(device)
criterion = nn.BCELoss()
optimizer = optimizers.Adam(model.parameters())
学習を実行します。
epochs = 40
train_loss_record = []
for epoch in range(epochs):
    train_loss = 0.
    for (x, _) in train_dataloader:
        x = x.to(device)
        model.train()
        preds = model(x)
        loss = criterion(preds, x)
        optimizer.zero_grad()
        loss.backward()
        optimizer.step()
        train_loss += loss.item()

    train_loss /= len(train_dataloader)
    train_loss_record.append(train_loss)

    if epoch%4 == 0:
        print("Epoch: {}, Loss: {:3f}".format(epoch+1, train_loss))
学習の様子を可視化します。
plt.plot(range(1, len(train_loss_record)+1), train_loss_record)
plt.xlabel("Epochs")
plt.ylabel("Error")
plt.show()
入力画像と出力画像の比較を行います。
n_img = 10

x = x_train[:n_img]
mid_out = model.l1(x)
out = model(x)

plt.figure(figsize=(10, 3))
for i in range(n_img):

    ax = plt.subplot(3, n_img, i+1)
    plt.imshow(x_train[i].reshape(img_size, -1).tolist(), cmap="Greys_r")

    ax.get_xaxis().set_visible(False)
    ax.get_yaxis().set_visible(False)

    ax = plt.subplot(3, n_img, i+1+n_img)
    plt.imshow(mid_out[i].reshape(4, -1).tolist(), cmap="Greys_r")
    ax.get_xaxis().set_visible(False)
    ax.get_yaxis().set_visible(False)

    ax = plt.subplot(3, n_img, i+1+2*n_img)
    plt.imshow(out[i].reshape(img_size, -1).tolist(), cmap="Greys_r")
    ax.get_xaxis().set_visible(False)
    ax.get_yaxis().set_visible(False)
keras
kerasで同じものを実装します。
まず必要なライブラリのインポートをします。
from tensorflow.keras.models import Sequential, Model
from tensorflow.keras.layers import Input, Activation, Dense
データは他のものと同様のものもを使用します。
digits_data = datasets.load_digits()
x_train = np.asarray(digits_data.data)
x_train /= 15
y = digits_data.target
モデルの作成をします。Sequential()を使用します。
input_shape=x_train.shape[1:]
model = Sequential()
model.add(Dense(16, activation='relu', input_shape=input_shape, name='fc1'))
model.add(Dense(64, activation='softmax', name='fc2'))
モデルをコンパイルします。
model.compile(optimizer='adam',
              loss='binary_crossentropy')
学習を実行します。
history = model.fit(x_train, x_train,
                    epochs=100,
                    batch_size=32,
                    shuffle=True,
                    validation_data=(x_train, x_train))
学習の様子を可視化します。
plt.plot(range(1, len(history.history['loss'])+1), history.history['loss'])
plt.xlabel("Epochs")
plt.ylabel("Error")
plt.show()
入力画像と出力画像を比較します。
n_img = 10

x = np.float64(x_train[:n_img])
mid_out = np.array(model.layers[0](x))
out = np.array(model(x))

plt.figure(figsize=(10, 3))
for i in range(n_img):

    ax = plt.subplot(3, n_img, i+1)
    plt.imshow(x_train[i].reshape(img_size, -1).tolist(), cmap="Greys_r")

    ax.get_xaxis().set_visible(False)
    ax.get_yaxis().set_visible(False)

    ax = plt.subplot(3, n_img, i+1+n_img)
    plt.imshow(mid_out[i].reshape(4, -1).tolist(), cmap="Greys_r")
    ax.get_xaxis().set_visible(False)
    ax.get_yaxis().set_visible(False)

    ax = plt.subplot(3, n_img, i+1+2*n_img)
    plt.imshow(out[i].reshape(img_size, -1).tolist(), cmap="Greys_r")
    ax.get_xaxis().set_visible(False)
    ax.get_yaxis().set_visible(False)
参考文献


