目的
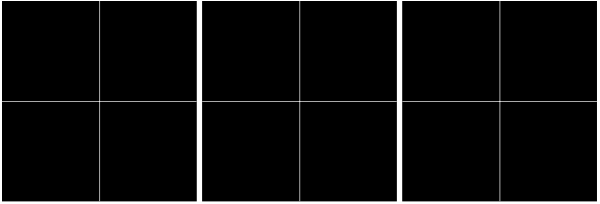
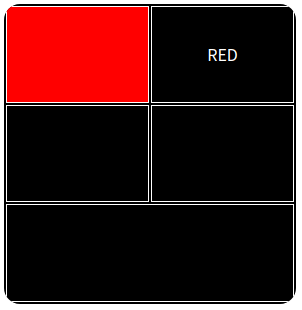
完成イメージのように、ステータスを表示するダッシュボード画面上に四角いオブジェクトがあり、格子状の枠を作って色を塗りつぶしたり、テキストを入れるのがゴールです。使っているのはJavaScriptのライブラリd3.jsです。
ポイントは2つ。
初めは座標位置を指定してpathやareaで力技で描画することを考えたのですが、テキストのセンタリングやオブジェクトの拡大・縮小で破綻するので止めて、Webで色々調べつつまとめてみました。
本記事は、d3.jsでコードを書いたことがある人を前提に書いています。
完成イメージ
完成版HTML
最初に完成形を貼っておきます。
<html>
  <head>
    <script src="https://d3js.org/d3.v6.min.js"></script>
    <style>
/* おまじない */
table {
  border-collapse: collapse;
  border-spacing: 0;
}
    </style>
  </head>
  <body>
    <div id="svg-area"></div>
    <script>
'use strict';
let data = [
  {t:'RED',c:'#ff0000'},
  {t:'GREEN',c:'#00ff00'},
  {t:'BLUE',c:'#0000ff'}
];
let width = 1000;
let height = 500;
let gridSize = 300;
let gap = 8;
let svg = d3.select("#svg-area").append("svg")
  .attr("width",width)
  .attr("height",height);

/* 角Rをつけた四角い図形でくり抜く */
svg.append("clipPath")
  .attr("id","clip")
  .selectAll("rect")
  .data(data)
  .enter()
  .append("rect")
  .attr("width", gridSize-gap)
  .attr("height", gridSize)
  .attr("x", (d,i) => i*gridSize)
  .attr("y", 0)
  .attr("rx", 16)
  .attr("ry", 16);

let g = svg.append("g")
  .attr("width",width)
  .attr("height",height);

let cards = g.selectAll("rect").data(data);

/* ベースとなる四角 */
cards.enter().append("rect")
  .attr("id",(d,i) => "card-"+i)
  .attr("x", (d,i) => i*gridSize)
  .attr("y", 0)
  .attr("width", gridSize-gap)
  .attr("height", gridSize)
  .attr("clip-path", "url(#clip)")
  .style("fill", "#000000");

/* tableタグのためのforeignObject要素 */
let table = cards.enter().append("foreignObject")
  .attr("x", (d,i) => i*gridSize)
  .attr("y", 0)
  .attr("width", gridSize-gap)
  .attr("height",gridSize)
  .attr("clip-path", "url(#clip)")
  .append("xhtml:table")
  .attr("width", gridSize-gap)
  .attr("height",gridSize)
  .attr("border",1)
  .attr("frame","void")
  .attr("bordercolor","#ffffff");

/* 通常のtableタグと同様に表の内部を作る */
let tr1 = table.append("tr");
let tr2 = table.append("tr");
let tr3 = table.append("tr");
tr1.append("td")
  .attr("height","33%")
  .attr("width","50%")
  .attr("bgcolor", (d) => d.c);
tr1.append("td")
  .attr("height","33%")
  .attr("width","50%")
  .style("text-align", "center")
  .append("font")
  .attr("color", "#ffffff")
  .text((d) => d.t);

tr2.append("td")
  .attr("height","33%");

tr2.append("td")
  .attr("height","33%");

tr3.append("td")
  .attr("colspan",2);
    </script>
  </body>
</html>
ヘッダ
細かく見ていきます。
ヘッダはシンプルにd3.jsライブラリを読み込むだけです。なお、styleタグの記述がないと枠にスペースが出来てしまいます。3
<html>
  <head>
    <script src="https://d3js.org/d3.v6.min.js"></script>
    <style>
/* おまじない */
table {
  border-collapse: collapse;
  border-spacing: 0;
}
    </style>
  </head>
ボディ
こちらもシンプルで、div要素のみ。
  <body>
    <div id="svg-area"></div>
    <script>
    ...
    </script>
  </body>
オブジェクトを作る
次に、オブジェクトを実際に作っていきます。まずはベースとなる四角いオブジェクトを作成します。
'use strict';
let data = [
  {t:'RED',c:'#ff0000'},
  {t:'GREEN',c:'#00ff00'},
  {t:'BLUE',c:'#0000ff'}
];
let width = 1000;
let height = 500;
let gridSize = 300;
let gap = 8;
let svg = d3.select("#svg-area").append("svg")
  .attr("width",width)
  .attr("height",height);

let g = svg.append("g")
  .attr("width",width)
  .attr("height",height);

let cards = g.selectAll("rect").data(data);

/* ベースとなる四角 */
cards.enter().append("rect")
  .attr("id",(d,i) => "card-"+i)
  .attr("x", (d,i) => i*gridSize)
  .attr("y", 0)
  .attr("width", gridSize-gap)
  .attr("height", gridSize)
//  .attr("clip-path", "url(#clip)")
  .style("fill", "#000000");
格子状の枠を作る
内部にtableタグを作成することで枠を作ります。foreignObjectを使ってそれを重ねるイメージです。分かりやすいように以下のような2x2の表を作るとします。
<table>
  <tr>
    <td></td>
    <td></td>
  </tr>
  <tr>
    <td></td>
    <td></td>
  </tr>
</table>
以下のようなコードになります。
/* tableタグのためのforeignObject要素 */
let table = cards.enter().append("foreignObject")
  .attr("x", (d,i) => i*gridSize)
  .attr("y", 0)
  .attr("width", gridSize-gap)
  .attr("height",gridSize)
//  .attr("clip-path", "url(#clip)")
  .append("xhtml:table")
  .attr("width", gridSize-gap)
  .attr("height",gridSize)
  .attr("border",1)
  .attr("frame","void")
  .attr("bordercolor","#ffffff");

/* 完成版HTMLと違います */
let tr1 = table.append("tr");
let tr2 = table.append("tr");
tr1.append("td")
  .attr("height","50%")
  .attr("width","50%");
tr1.append("td")
  .attr("height","50%")
  .attr("width","50%");
tr2.append("td")
  .attr("height","50%")
  .attr("width","50%");
tr2.append("td")
  .attr("height","50%")
  .attr("width","50%");
するとこんな感じで格子状の枠が作れました。完成イメージにするには、3段にする、背景色を指定する、カラムを結合する、テキストを加えるなど、通常のtableと同じような作業をやります。

角を丸くする
最後に角を丸くするには、clipPathを使います。描画部分を窓枠のようにマスクするイメージで、Web検索すれば色々出てきます。
以下のコードを追加し、上記解説のclip-path属性のコメントアウトを外します。
/* 角Rをつけた四角い図形でくり抜く */
svg.append("clipPath")
  .attr("id","clip")
  .selectAll("rect")
  .data(data)
  .enter()
  .append("rect")
  .attr("width", gridSize-gap)
  .attr("height", gridSize)
  .attr("x", (d,i) => i*gridSize)
  .attr("y", 0)
  .attr("rx", 16)
  .attr("ry", 16);
まとめ
いかがでしたでしょうか?完成イメージのような図形でも、自由度の高いd3.jsライブラリを使えば割と簡単に描くことが出来るのがいいところです。
-
<foreignObject> - SVG: Scalable Vector Graphics | MDN (https://developer.mozilla.org/ja/docs/Web/SVG/Element/foreignObject) ↩
-
<clipPath> - SVG: Scalable Vector Graphics | MDN (https://developer.mozilla.org/ja/docs/Web/SVG/Element/clipPath) ↩
-
テーブルのセルの隙間をリセットするCSS (https://qiita.com/macer_fkm/items/bac56f0f863a19cfd674) ↩


