趣味プログラマーの作業メモのような投稿になりますので、ご注意ください。間違いや指摘は大歓迎です。
きっかけ
-
M-1グランプリの準々決勝に知人のガーベラガーデンが進出したのでM-1について調べたくなった
(動画配信されたようなので宣伝。https://gyao.yahoo.co.jp/player/11185/v00046/v0000000000000001148/) -
Jupyter Notebookを自宅の外でも使いたいニーズをGoogleColaboratoryで満たせることを知った
-
WEBスクレイピングに興味があった
GoogleColaboratory
開いたらJupyterLikeでした。ショートカットキーなどは違いますが習熟すればよいです。
https://colab.research.google.com/
注意点としては、特定の時間が経過するとインスタンスリセットになるので、作業結果をちゃんと定期的に保管しておかないといけません。
(参考記事:https://qiita.com/ku_don/items/2770df602dd7778d4ce6)
スクレイピング
ちゃんとルールを守ってスクレイピングしましょうということで、Robot.txtを確認。
最初の一行目で、その場でパッケージインストールしてくれてます。
(参考:https://vaaaaaanquish.hatenablog.com/entry/2017/12/01/064227)
!pip install robotexclusionrulesparser
import robotexclusionrulesparser

rerp = robotexclusionrulesparser.RobotExclusionRulesParser()
rerp.fetch('https://www.google.com/robots.txt')
if rerp.is_allowed('*', '/search'):
    print("OK")
else:
    print("NG")
最初はWEBページでDOM使って要素を抽出しようかと思いましたが、JSONファイルでコンビごとにデータを持ってきているWEBページを内容を生成していましたので、JSONファイルをそのままお借りすることにしました。
また、大量アクセスで迷惑をかけちゃいけないお作法として、1秒1アクセスで300アクセス毎にGoogleDriveにJSONデータを保管していきました。
import requests

def getJson(num):
  url = 'https://www.m-1gp.com/combi/json/' + str(num) + '.json'
  json_data = requests.get(url)
  # 200以外のStatusコードで判別しようとしたが、全部200だった
  #if json_data.status_code==200:
  #  return json_data.json()
  #else:
  #  print(json_data.status_code)
  try:
    return json_data.json()
  except:
    return None

data = {}

import json
import time

!pip install -U -q PyDrive
from pydrive.auth import GoogleAuth
from pydrive.drive import GoogleDrive
from google.colab import auth
from oauth2client.client import GoogleCredentials
file_id = 'xxxxxxxxxxxxxxxxxxxxxxxxxxxxxxx'

for num in range(len(data)+1, 9600):
  j = getJson(num)
  if j is not None:
    data.update({str(num): j})
  else:
    print("error id: " + str(num))

  if num % 300 == 0:
      print(len(data))

      auth.authenticate_user()
      gauth = GoogleAuth()
      gauth.credentials = GoogleCredentials.get_application_default()
      drive = GoogleDrive(gauth)

      upload_file_1 = drive.CreateFile({'id': file_id})
      upload_file_1.SetContentString(json.dumps(data))
      upload_file_1.Upload()
  time.sleep(1)
だいたい一度ぐらいインスタンスリセットされるのので、読み込む箇所も作っておきます
file_id = 'xxxxxxxxxxxxxxxxxxxxxxxxxxxxxxxxxxxxxxx'
drive_file = drive.CreateFile({'id': file_id})

import json
json_dict = json.loads(drive_file.GetContentString())
data  =json_dict
matplotlab
あとはローカルJupyterのときと同様に、日本語フォントを準備して描いていけば完成です。
!apt-get -y install fonts-ipafont-gothic

import matplotlib.font_manager as fm
fm.findSystemFonts()

import matplotlib
matplotlib.get_cachedir()

!rm /root/.cache/matplotlib/fontList.json

%matplotlib inline
import pandas as pd
import matplotlib.pyplot as plt

plt.rcParams['font.family'] = 'IPAPGothic' #全体のフォントを設定

plt.rcParams["figure.figsize"] = [20, 12]
plt.rcParams['font.size'] = 20 #フォントサイズを設定 default : 12
plt.rcParams['xtick.labelsize'] = 15 # 横軸のフォントサイズ
plt.rcParams['ytick.labelsize'] = 15


list = []

for key, value in json_dict.items():
  try:
    if 'belong' in value and 'entrant' in value:
      if '2018' in value['entrant']:
        list.append(value['belong'])other_val = sum(df[df['count']<15]['count'])
df_t = df[df['count']>=15]
df_t = df_t.append({'所属': 'その他', 'count':other_val}, ignore_index=True)

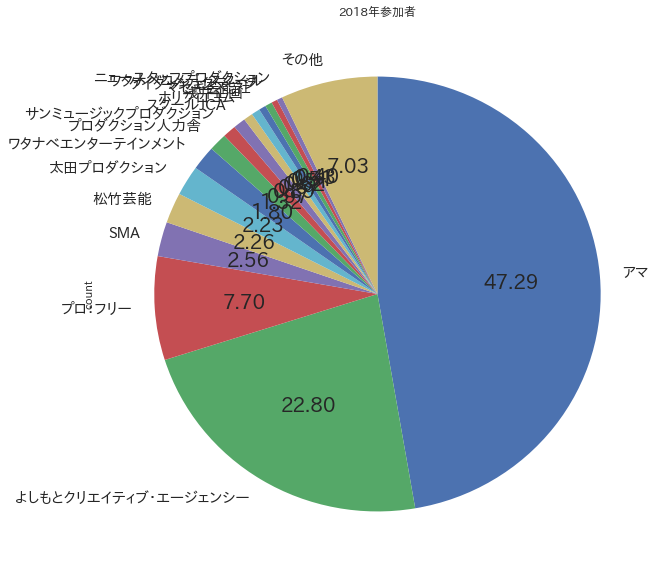
df_t['count'].plot(kind='pie', startangle=90, counterclock=False, autopct='%.2f', labels=df_t['所属'].tolist(), figsize=(10, 10), title='2018年参加者')
  except:
    print(key)

import collections
c = collections.Counter(list)

df = pd.DataFrame.from_dict(c, orient='index').reset_index()
df = df.rename(columns={'index':'所属', 0:'count'})
df = df.sort_values('count', ascending=False)

other_val = sum(df[df['count']<15]['count'])
df_t = df[df['count']>=15]
df_t = df_t.append({'所属': 'その他', 'count':other_val}, ignore_index=True)

df_t['count'].plot(kind='pie', startangle=90, counterclock=False, autopct='%.2f', labels=df_t['所属'].tolist(), figsize=(10, 10), title='2018年参加者')
ほかにも、9人のお笑いグループがいることがわかったりして、なかなかしばらくいじくれそうです。
