はじめに
二値分類では評価がやりやすいですが、他クラス分類時では結構いろんな評価指標あって迷いますよね。
(再現率だ、適合率だAUCだなんだかんだ...)
しかし、pythonには便利なライブラリがあります。
各クラスの適合率や再現率がひと目でわかったり、どのクラスに分類間違いしているかなどを視覚的に理解できるライブラリを紹介します。
他クラス分類時に汎用的で少ないコードで使うこともでき非常に便利な2つのライブラリ。
**- classification report
- confusion matrix**
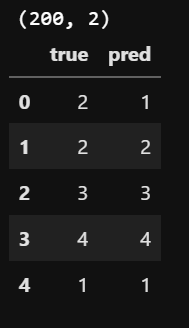
テストデータの作成
評価に使用するテストデータを作成します。
import random
import pandas as pd
from sklearn.metrics import classification_report, confusion_matrix
import matplotlib.pyplot as plt
import seaborn as sns

# データ作成
df = pd.DataFrame()

# 正解列
df["true"] = [random.randint(0,5) for i in range(200)]

# 予測列
# エラーを作るため適当に20個のインデックスで書き換え
err_idx = df.sample(20).index
df["pred"] = df["true"]
df.loc[err_idx, "pred"] = [random.randint(0,5) for i in err_idx]
print(df.shape)
df.head()
classification report
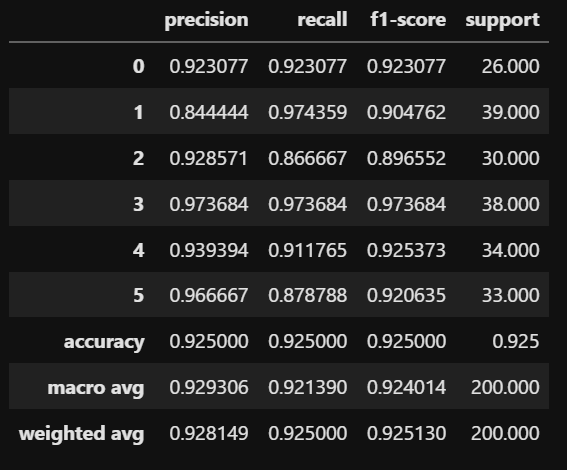
classification reportを使うと、各クラスの適合率や再現率、F値を簡単に把握できます。
DataFrame形式に落とし込むと表示が楽になります。
df_report = pd.DataFrame(classification_report(df["true"], df["pred"],
                                               output_dict=True)).T
df_report
うむ、楽ちん。
confusion matrix
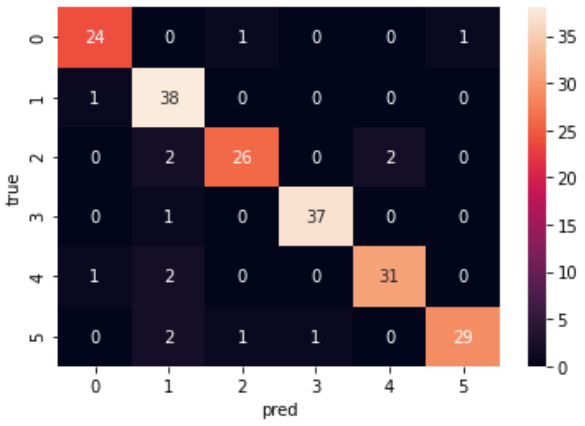
confusion matrixを使うと、各クラスがどのように分類間違いしたかを視覚的に理解できます。
sns.heatmap(confusion_matrix(df["true"], df["pred"]), annot=True)
plt.xlabel("pred")
plt.ylabel('true')
うん、見やすい。
終わりに
classification reportとconfusion matrixの紹介でした。
少ないコードで視覚的に理解できるので、とりあえず使っておくと便利です。


